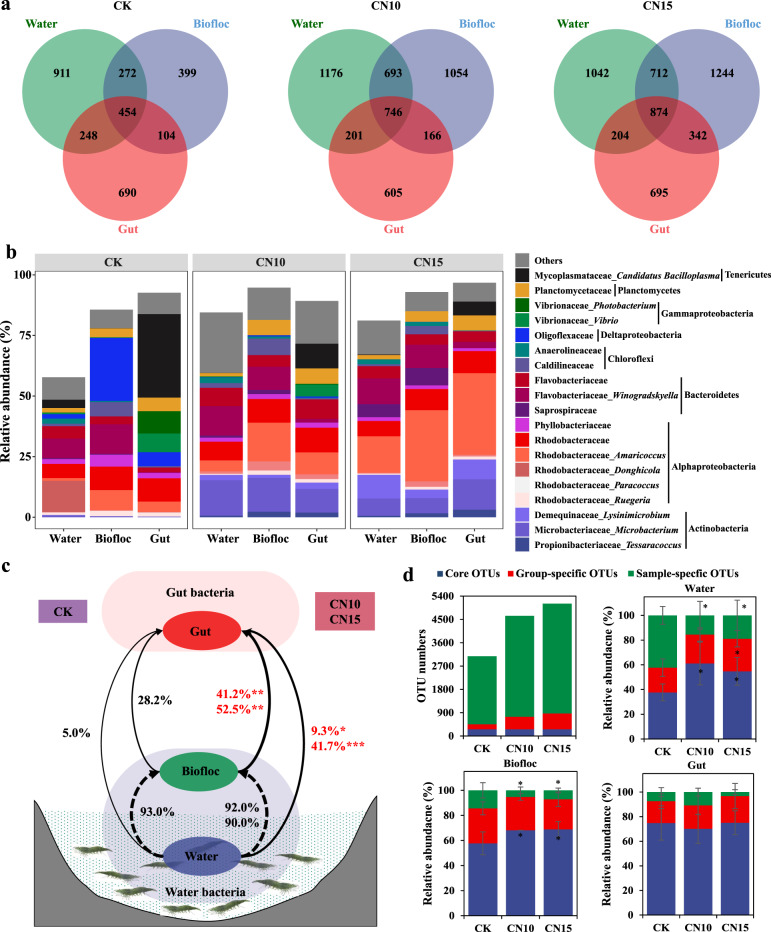
Fig. 2. Effects of sucrose addition on the bacterial community compositions of rearing water, biofloc, and gut in the shrimp culture systems.
a Venn analysis of bacterial communities at the OTU level among rearing water, biofloc, and gut in control and sucrose addition culture systems. b The relative abundances of bacterial taxa at genus level shared by rearing water, biofloc, and gut in each culture system. c The percentage contributions of bacterial sources for biofloc and gut samples in each culture system based on the SourceTracker analysis. d The numbers and relative abundances of core and specific OTUs in each culture system. CK: without sucrose addition; CN10: the C/N ratio of about 10:1 obtained by sucrose addition; CN15: the C/N ratio of about 15:1 obtained by sucrose addition. Each sample had six replicates (n = 6), except the water samples (n = 4) and biofloc samples (n = 2) in control group. Error bars show standard error in (d). Different asterisks indicate a significant difference at *p < 0.05, **p < 0.01, and ***p < 0.001 in (c) and (d) based on Student’s t test.

