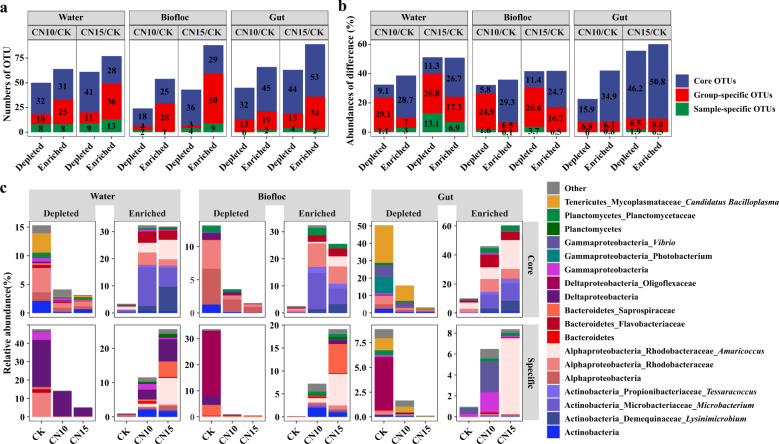
Fig. 3. The numbers and relative abundances of discriminatory OTUs in rearing water, biofloc, and gut samples between control and sucrose addition culture systems.
a Number of significantly discriminatory OTUs (PFDR < 0.05) detected in rearing water, biofloc, and gut samples between control and sucrose addition groups. b The cumulative abundances of significantly enriched and depleted OTUs in rearing water, biofloc, and gut samples between control and sucrose addition groups. c The relative abundances and compositions of significantly enriched and depleted OTUs in rearing water, biofloc, and gut samples between control and sucrose addition groups. CK: without sucrose addition; CN10: the C/N ratio of about 10:1 obtained by sucrose addition; CN15: the C/N ratio of about 15:1 obtained by sucrose addition. Each sample had six replicates (n = 6), except the water samples (n = 4) and biofloc samples (n = 2) in control group.

