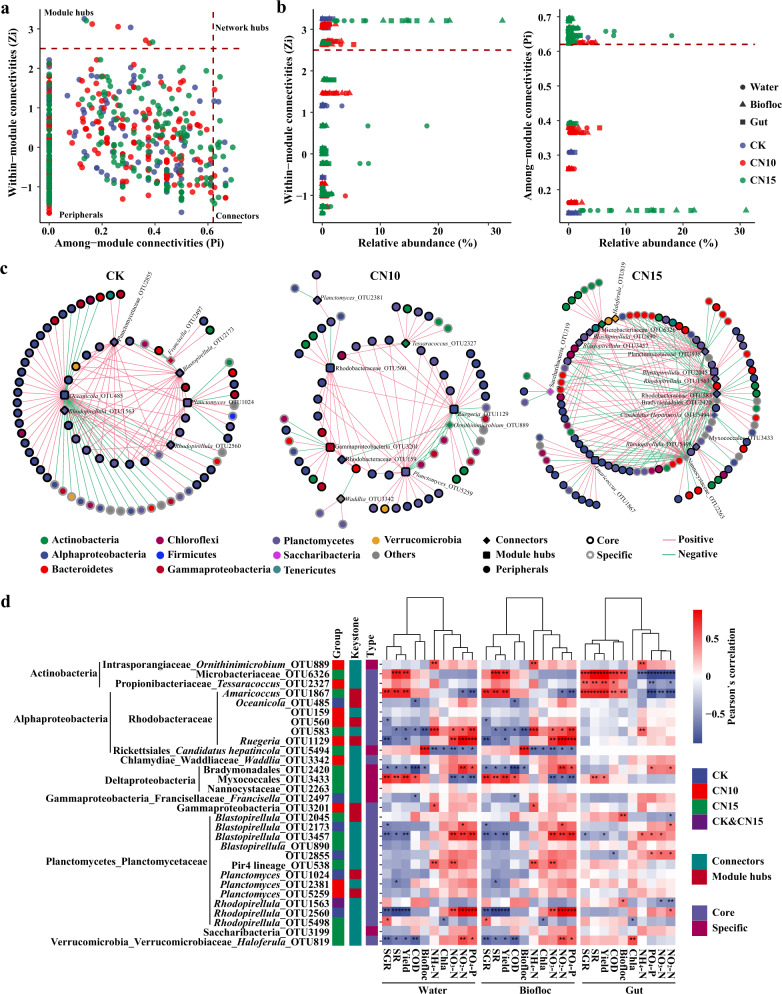
Fig. 5. Identifying the keystone taxa of each bacterial networks and their associations with water quality and shrimp growth parameters.
Keystone taxa (a) and their relative abundances (b) in bacterial communities of CK (n = 12), CN10 (n = 18) and CN15 (n = 18) groups. c The relationships of keystone OTUs and the OTUs they recruited in CK (n = 12), CN10 (n = 18) and CN15 (n = 18) groups. d Pearson’s correlation analysis between keystone OTUs, water quality parameters, biofloc volume and shrimp growth performance. NH4-N, ammonium-N; NO2-N, nitrite-N; NO3-N, nitrate- N; PO4-P, phosphate-P; COD, chemical oxygen demand; Chl-a, Chlorophyll a; SR, survival rate; SGR, specific growth rate; Yield, total yield of shrimp each pond. Different asterisks indicate a significant difference at *p < 0.05, **p < 0.01, and ***p < 0.001 in (d) based on Student’s t test. CK: without sucrose addition; CN10: the C/N ratio of about 10:1 obtained by sucrose addition; CN15: the C/N ratio of about 15:1 obtained by sucrose addition.

