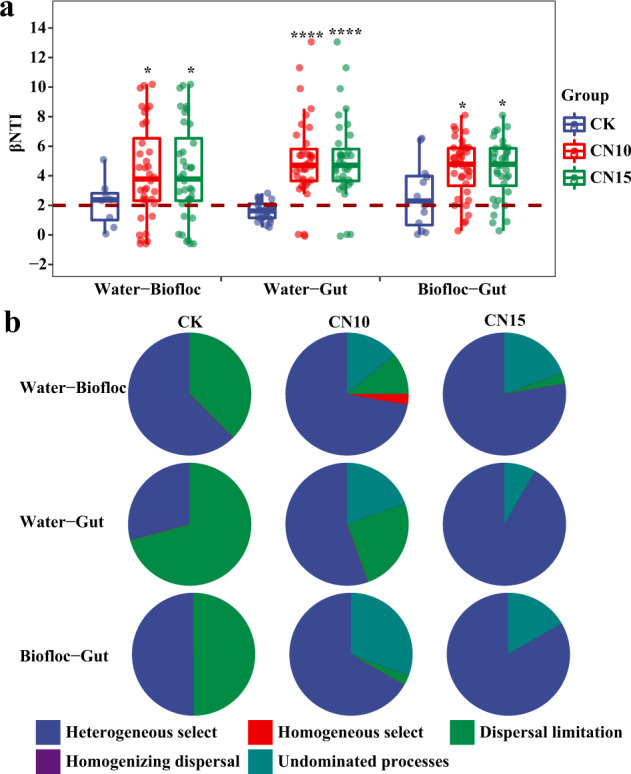
Fig. 6. The ecological processes of bacteria from water to biofloc, water to gut, and biofloc to gut in control and sucrose addition groups.

a The βNTI values. The boxes represent the median and interquartile range, and whiskers range from minimum to maximum values. Different asterisks indicate a significant difference at *p < 0.05, and ****p < 0.0001 based on Student’s t test. b The contributions of stochastic processes and deterministic process on the bacterial assembly. Each sample had six replicates (n = 6), except the water samples (n = 4) and biofloc samples (n = 2) in control group. CK: without sucrose addition; CN10: the C/N ratio of about 10:1 obtained by sucrose addition; CN15: the C/N ratio of about 15:1 obtained by sucrose addition.
