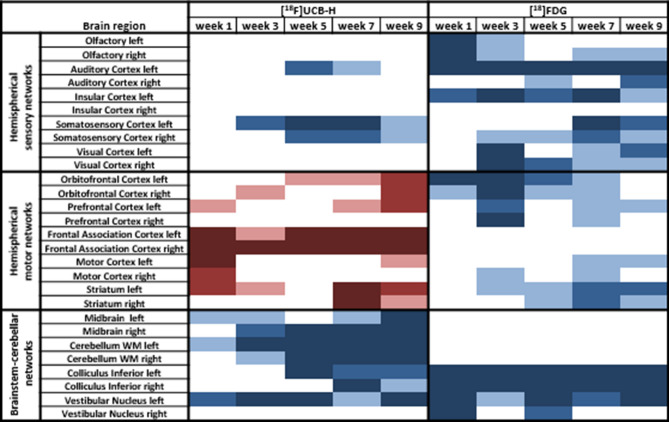
Figure 1.
Overview of the changes in synaptic density measured by [18F]UCB-H PET (left side) and regional cerebral glucose metabolism (rCGM) measured by [18F]FDG PET (right side) in 28 selected brain regions, which are known to be involved in vestibular and sensorimotor processing. Mean normalized activity values per segmented brain region at 1, 3, 5, 7 and 9 weeks post bilateral labyrinthectomy (BL) were statistically compared using a one-way repeated measurement ANOVA with post-hoc paired t-tests and Bonferroni correction for multiple testing. Significant increases in synaptic density or rCGM are visualized in red scales (light red: p < 0.05, red: p < 0.005, dark red: p < 0.001), decreases in blue scales (light blue: p < 0.05, blue: p < 0.005, dark blue: p < 0.001). Comparison of [18F]UCB-H and [18F]FDG patterns shows a complex structure–function relationship across brain networks. [18F]FDG: [18F]fluorodeoxyglucose.

