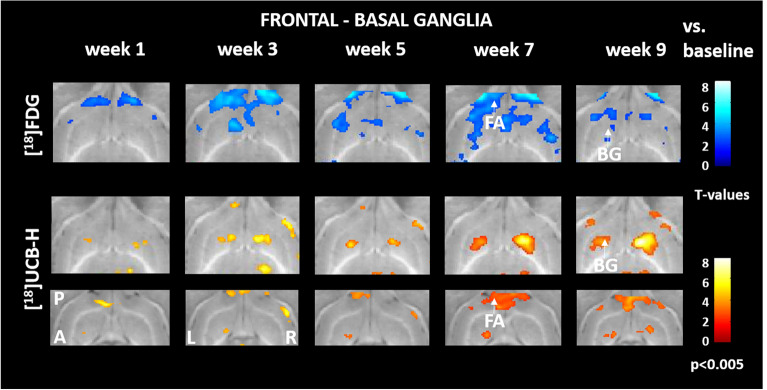
Figure 4.
Comparison of regional cerebral glucose metabolism and synaptic density in frontal–basal ganglia networks. Reduced [18F]FDG uptake in the frontal association cortex and striatum was paralleled by an increase in [18F]UCB-H binding. A: anterior, P: posterior, Le: left, Ri: right, BG: basal ganglia, FA: frontal association cortex, [18F]FDG: [18F]fluorodeoxyglucose. Changes against baseline are depicted as t-values at a significance level of p < 0.005.

