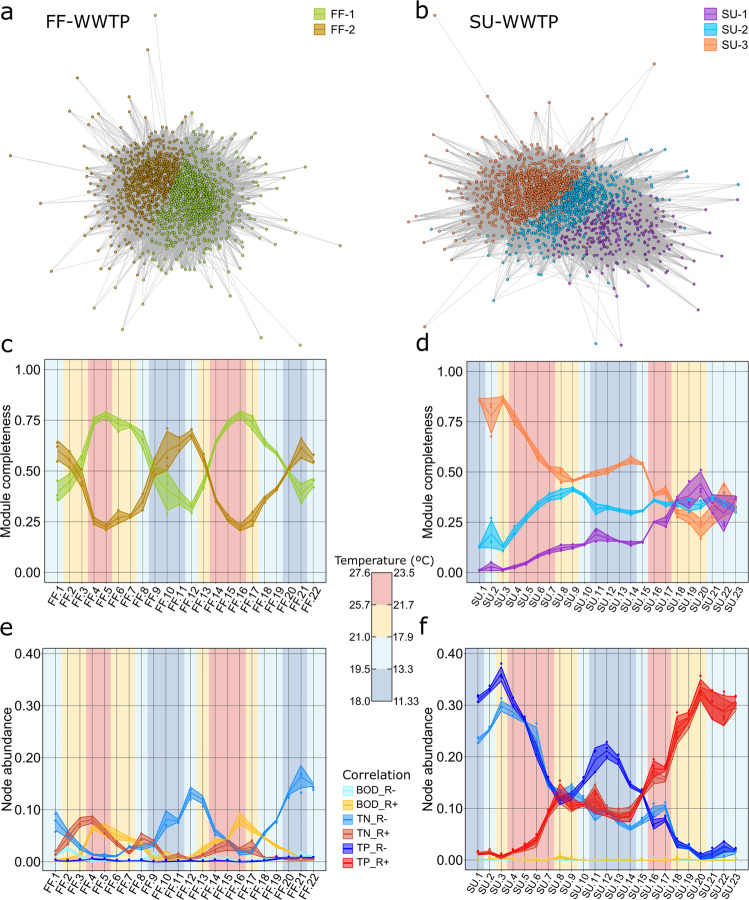
Fig. 1. Ecological clusters based on co-occurrence patterns.
The left panels represent data from the fully functional plant (FF-WWTP), and the right panels represent the starting up plant (SU-WWTP). Network nodes represent community members (ASV) and edges significant relationships between nodes (probability of co-occurrence higher than 0.95). a, b Nodes are colored based on their module membership, being FF-WWTP divided in two different modules (FF-1, green and FF-2, brown) and SU-WWTP in three (SU-1, purple; SU-2, blue; and SU-3, orange). c, d Module completeness, the proportion of nodes belonging to a given module present in each individual sample. e, f Abundance of nodes correlated to any given pollutant removal rate. The central lines correspond to average values (n = 3) of each sample, and the shaded areas correspond to the standard deviation. The background of the plots is colored based on the temperature measured when collecting samples. Temperature data were divided in quartiles (between 18.0 and 27.6 °C for FF-WWTP and, between 11.33 and 23.50 °C for SU-WWTP) for a simpler representation. Temporal sampling frame includes a 2-year monthly sampling from April 2017 to March 2019 (August not sampled) for FF-WWTP and from March 2017 to February 2019 (June 2019 not sampled) for SU-WWTP.

