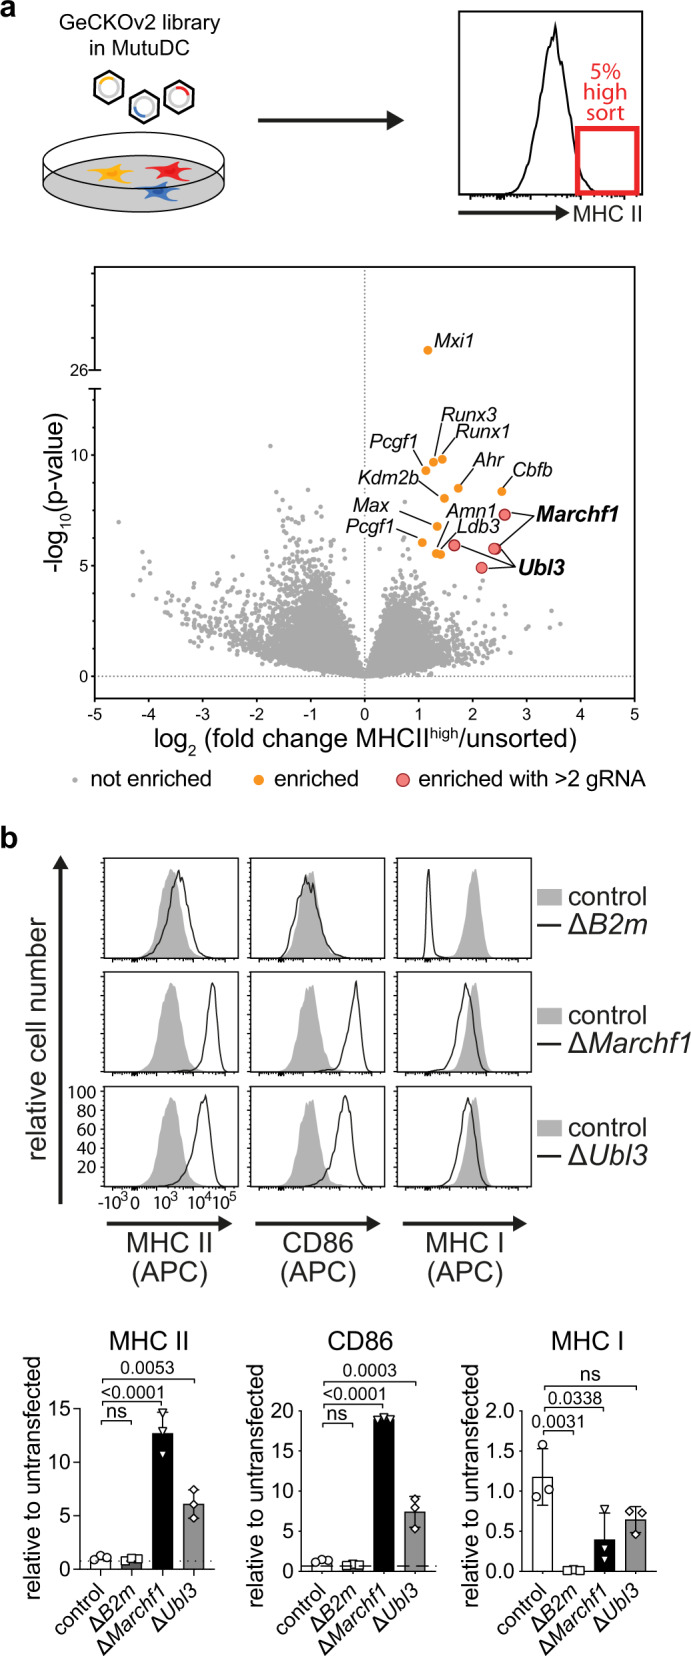
Fig. 1. Ubl3 regulates surface expression of MHC II and CD86 in MutuDCs.

a Schematic of CRISPR/Cas9 genetic screen. MutuDCs were lentivirally transduced with the GeCKOv2 library A and puromycin-resistant cells were stained for surface MHC II. The 5% highest MHC II expressing cells were sorted by flow cytometry, genomic DNA extracted, and amplified. gRNAs were quantified by Illumina NextSeq sequencing and analyzed with edgeR. Volcano plots show detected gRNAs enriched in sorted cells with increased MHC II expression compared to the unsorted library. P values were assessed using a negative binomial generalized linear model with a two-sided likelihood ratio test, with adjustment for multiple testing using the Benjamini–Hochberg false discovery rate (FDR) method. Guide RNAs with an absolute log2 fold change >1 and FDR of <0.01 were considered significantly enriched (orange dots), with genes hit by at least two gRNAs highlighted (large red circles). b Surface expression of MHC II, CD86, or MHC I were analyzed by flow cytometry for MutuDCs lacking B2m (pool), Marchf1, or Ubl3 (single-cell clones), compared with control cells expressing non-targeting hBim gRNA. Top: representative histograms, with gray solid histograms: control MutuDCs expressing non-targeting hBim gRNA, black lined histograms: CRISPR/Cas9 modified MutuDC lines as indicated. Bottom: quantification of flow cytometry analysis from three experiments. Bars indicate mean+SD of geometric mean fluorescence intensity (gMFI), relative to untransfected cells. Statistical analysis was performed using a one-way ANOVA and Bonferroni’s multiple comparisons test, comparing each sample to hBim controls, p values shown above bars, ns (not significant) p > 0.05.
