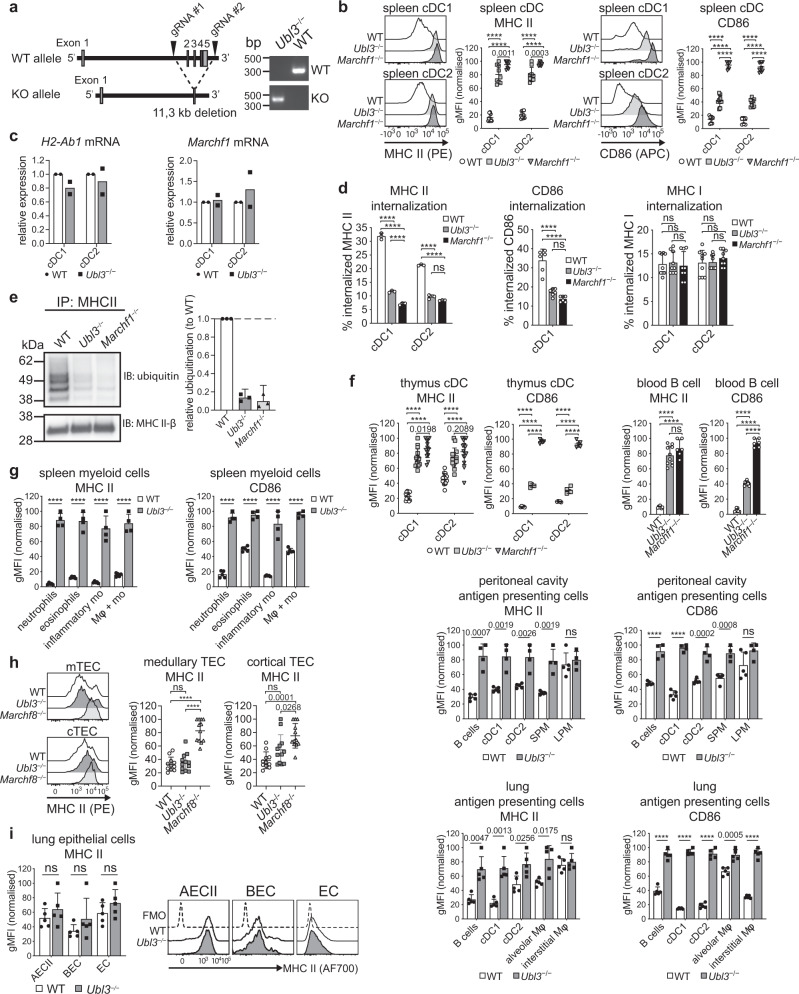
Fig. 4. UBL3 regulates MHC II and CD86.
a Ubl3−/− mice. b Spleen cDC surface MHC II and CD86 by flow cytometry. Representative histograms and graphs showing gMFI relative to highest signal, bars mean ± SD, symbols individual mice (n = 9, three independent experiments). One-way ANOVA with Bonferroni’s test. c Quantitative real-time PCR of H2-Ab1 and Marchf1 mRNA in spleen cDCs. Bars mean ± SD relative to WT, n = 2 samples, two experiments. d Spleen cDCs labeled with FIP-conjugated mAb for MHC II, CD86, or MHC I were incubated for 30 mins at 37°C. Fluorescence was quenched (+Q) and internalization was calculated as described in Methods. CD86 internalization not shown for cDC2 (low expression). Data representative of two independent experiments with similar results (MHC II) or pooled from two (CD86) or three (MHC I) experiments performed in triplicate, mean ± SD, one-way ANOVA with Bonferroni’s test. e MHC II was immunoprecipitated (IP) from spleen cDCs using anti-MHC II antibody, analyzed by non-denaturing SDS-PAGE, and immunoblotted (IB) for ubiquitin and MHC II β-chain. Left: representative blot. Right: MHC II ubiquitination relative to WT, bars mean + 95% confidence interval for three biological replicates. f–i Flow cytometry of surface MHC II and CD86 of f professional antigen-presenting cells (thymus: n = 14, four experiments (MHC II), n = 5, one experiment (CD86); blood: n = 7 for WT, 10 for Ubl3−/−, 6 for Marchf1−/−, two experiments; peritoneal cavity: n = 5 for WT, 4 for Ubl3−/−, one experiment), g spleen myeloid cells (n = 5 for WT, 4 for Ubl3−/−, one experiment), h TEC (n = 11 for WT, 12 for Ubl3−/−, 12 for Marchf8−/−, four experiments), and i lung epithelial cells (n = 5, one experiment). Graphs show gMFI relative to highest gMFI, bars mean ± SD, symbols represent individual mice. One-way ANOVA with Bonferroni’s test, unpaired t test (two-sided) with Holm–Sidak correction. SPM small peritoneal macrophages, LPM large peritoneal macrophages, Mφ macrophages, mo monocytes, AECII type II lung alveolar epithelial cells, BEC bronchial epithelial cells, EC lung endothelial cells. p values above bars, with ****p < 0.0001, ns (not significant) p > 0.05.

