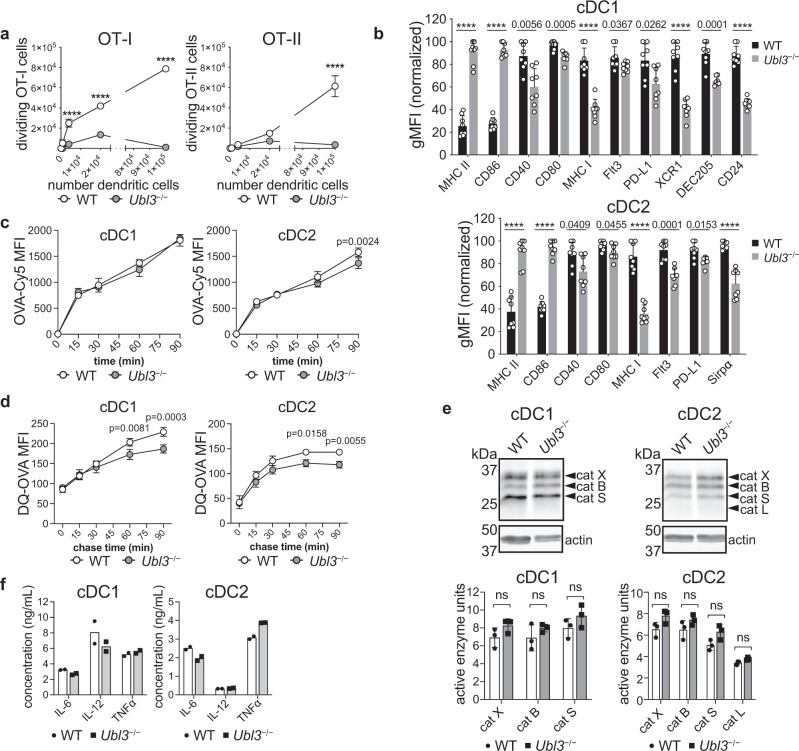
Fig. 7. Lack of UBL3 alters cDC function and phenotype.
a Ex vivo antigen presentation assay. WT and Ubl3−/− mice were injected with 1 µg of anti-CLEC9A-OVA mAb. Indicated numbers of spleen cDC1 and cDC2 were purified and co-cultured with OT-I or OT-II cells, and divided OT-I or OT-II cells enumerated by flow cytometry. Data with n = 3, representative of two experiments, mean ± SD, ****p < 0.0001, two-way ANOVA with Bonferroni’s test. b Flow cytometry analysis of relative cell surface marker expression of spleen cDC1 or cDC2 isolated from WT and Ubl3−/− mice, with n = 8 mice, two independent experiments, symbols represent individual mice, bars mean ± SD, ****p < 0.0001, unpaired t test (two-sided) with Holm–Sidak adjustment. c OVA-Cy5 uptake assay. Purified spleen cDC1 or cDC2 from WT or Ubl3−/− mice were incubated with 50 µg/ml OVA-Cy5 for the indicated times, and washed before flow cytometry analysis. Graphs show mean ± SD, with data from one experiment performed in triplicate, two-way ANOVA with Bonferroni’s test. d Proteolysis assay. Purified spleen cDC1 or cDC2 from WT or Ubl3−/− mice were pulsed with DQ-OVA for 15 min, washed twice and DQ-OVA signal was measured by flow cytometry at different chase time points. Graphs show mean ± SD, with data pooled from two independent experiments performed in triplicate, two-way ANOVA with Bonferroni’s test. e Quantification of cathepsin (cat) activity in spleen cDCs. Top: representative gel indicating active cathepsin X/B/S/L, and actin immunoblot. Bottom: relative protease activity normalized to actin, with bars showing mean ± SEM of one experiment with three biological replicates. Four spleens were pooled for each biological replicate, ns not significant, unpaired t test (two-sided). f Cytokine expression of purified Ubl3−/− and wild-type spleen cDC1 and cDC2 stimulated with CpG, IFN-γ, and GM-CSF. Bars display mean ± SD of cells stimulated in duplicate, using purified cDCs pooled from eight mice, representative of two independent experiments.

