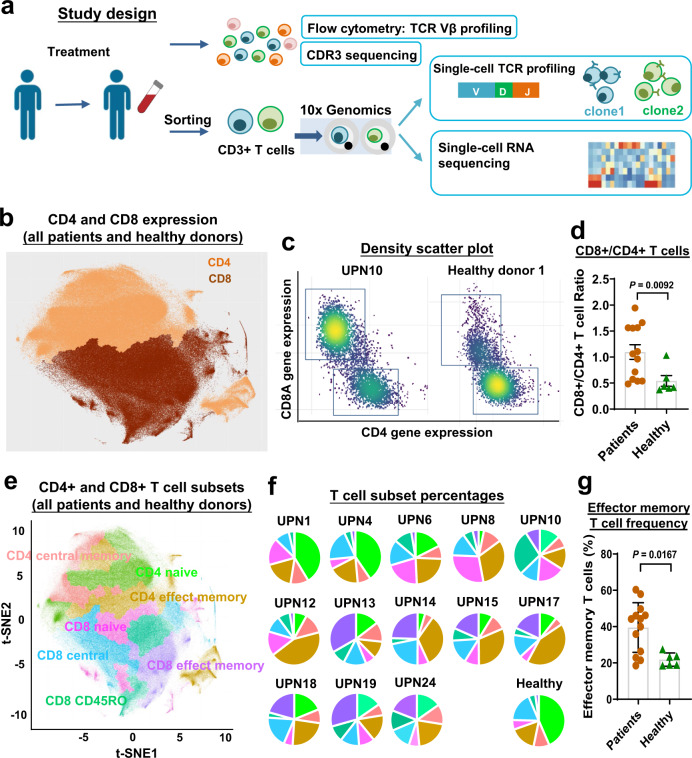
Fig. 1. A T cell landscape in T-LGLL patients.
a A scheme of experimental study design. b A t-distributed Stochastic Neighbor Embedding (t-SNE) plot of single-cell gene expression of T cells in all patients and healthy donors, colored by CD4+ and CD8+ T cell clusters. c Density scatter plots of CD4 and CD8A expression in T cells, generated using scRNA-seq results. x-axis, CD4 gene expression; y-axis, CD8A gene expression; dots were colored by cell density. d A CD8+/CD4+ T cell ratio was compared between patients (n = 13) and healthy donors (n = 6). Data are presented as mean values ± SEM; two-sided unpaired Mann–Whitney test. P value = 0.0092. e The same t-SNE plot in (b), color coded for CD4+ and CD8+ T cell subsets. f Pie charts showing percentages of T cell subsets in individual patients and healthy donors; color scheme as in (e). g Percentages of effector memory T cells were compared to patients (n = 13) and healthy donors (n = 6). Data are presented as mean values ± SEM; two-sided unpaired Mann–Whitney test, P value = 0.0167.

