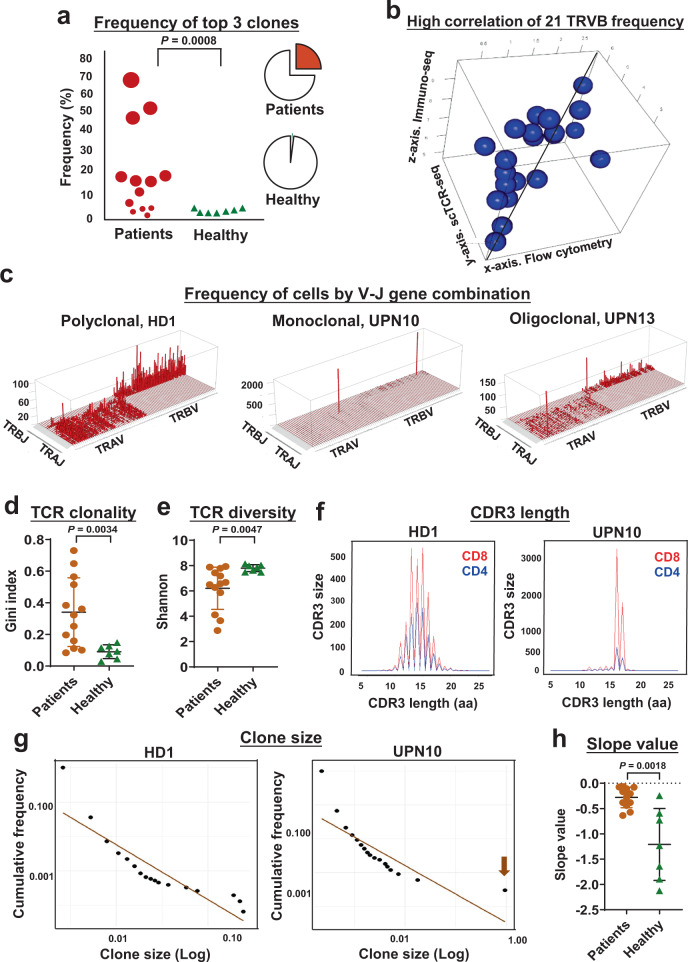
Fig. 2. Loss of TCR repertoire diversity in T-LGLL patients.
a Dot plot showing frequency of a sum of top 3 clones in individual patients and healthy donors. Dot sizes are proportional to frequency of top 3 clones. Pie charts on the right show medium percentages of a sum of the top 3 clones (red parts) in patients (top) and healthy donors (bottom). Two-sided unpaired t-test. P value = 0.0008. b Three-dimensional dot plot showing high correlation of frequency of 21 TRVB detected by flow cytometry (x-axis), scTCR-seq (y-axis) and immuno-seq (z-axis) in individual patients with an average correlation coefficient of 0.503. c Skyscraper plots showing Vβ/Vα and matching Jβ/Jα in healthy donor 1 (HD1) and representative patients (UPN10 and UPN13). Gini index (d) and Shannon index (e) of TCR clonality were compared in patients (n = 13) and healthy donors (n = 7). Data are presented as mean values ± SEM; two-sided unpaired Mann–Whitney test. P value = 0.0167 (d) and P value = 0.0047 (e). f CDR3 lengths of representative HD1 and patient UPN10 were plotted, with CDR3 lengths in amino acid (aa) on the x-axis and frequency (CDR3 size) on the y-axis (overlapped curves showing CD8+ and CD4+ T cells in red and blue, respectively). g Clone sizes were plotted in HD1 and UPN10, with log clone sizes on the x-axis and log cumulative frequency on the y-axis. h Slope values of power-law fitting plots were compared in all patients (n = 13) and healthy donors (n = 7); plots of all individuals are shown in Supplementary Figs. 6 and 7. Data are presented as mean values ± SEM; two-sided unpaired Mann–Whitney test. P value = 0.0018.

