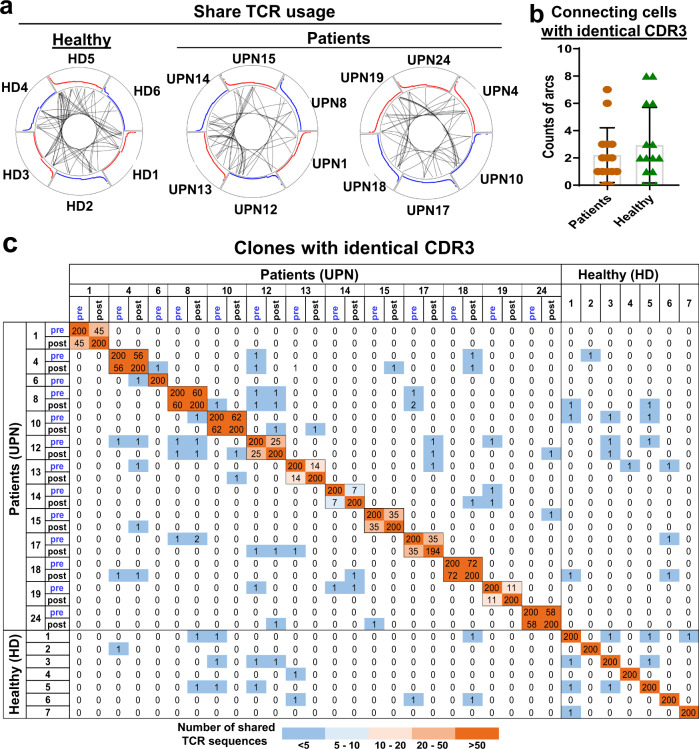
Fig. 3. Lack of common TCRA and TCRB clonotypes in T-LGLL patients.
a Circos plots are shown: segments in circles represent individual cells yielding rearranged TCR sequences. Black lines connected clones sharing identical CDR3 sequences among individuals. Sharing of identical CDR3 sequences among six healthy donors (HD1–HD6) is shown on the left; sharing of identical CDR3 sequences among patients (UPNs 1, 8, 12, 13, 14, and 15) and patients (UPNs 4, 10, 17, 18, 19 and 24) on the right. Red and blue curves are proportional to clone sizes. b Counts of arcs connecting cells with identical CDR3 sequences among patients (n = 13) and healthy donors (n = 7) were compared pair-wisely, and there was no significant difference. Data are presented as mean values ± SEM; two-sided unpaired Mann–Whitney test. c Heatmap plot showing shared CDR3 sequences among the top 200 TCR clones of patients and healthy donors. On both x- and y-axes, samples of patients and healthy donors are listed, and adjacent grids show paired samples (pre- and post-treatments) of the same patients. Counts of identical TCR clones shared among samples are shown. Color scheme, ranging from dark orange to dark blue, indicates the number of shared TCR CDR3 sequences, from high to low.

