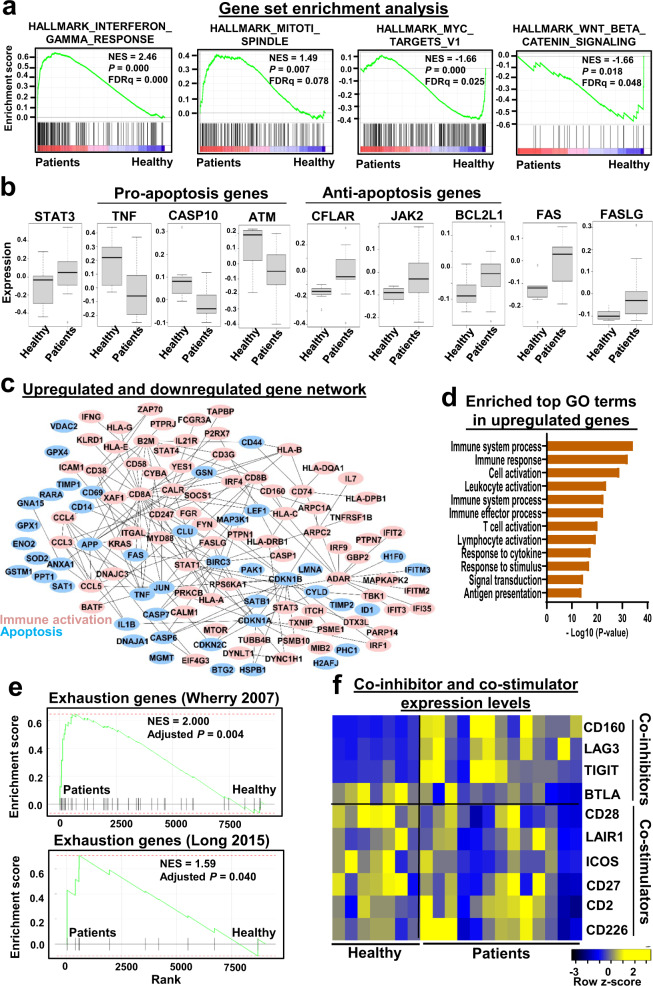
Fig. 5. Dysregulated gene programs in T-LGLL.
a Gene Set Enrichment Analysis (GSEA) plots of differentially expressed genes in T-LGLL patients compared with those in healthy donors. GESA based on a Kolmogorov Smirnov test. b Boxplots showing expression of pro-apoptosis and anti-apoptosis genes in T-LGLL patients (n = 13) compared with those in healthy donors (n = 7). Shown are 25–75% response ranges (top and bottom lines of boxes) and minima and maxima (bars). A the two-sided unpaired t-test. c A network of upregulated genes involved in the immune response and cell survival, and downregulated genes involved in apoptosis in T-LGLL patients. d Bar chart showing top GO terms enriched in upregulated genes in expanded clones compared to those in non-expanded clones in T-LGLL, Fisher’s exact test. e GSEA plots of T cell exhaustion genes in T-LGLL patients compared with those in healthy donors. T cells in patients consistently expressed higher levels of exhaustion markers, gene lists were from two previous publications42,43. GESA is based on a Kolmogorov Smirnov test. f T cells in patients did not consistently express higher levels of co-stimulators or lower levels of co-inhibitors.

