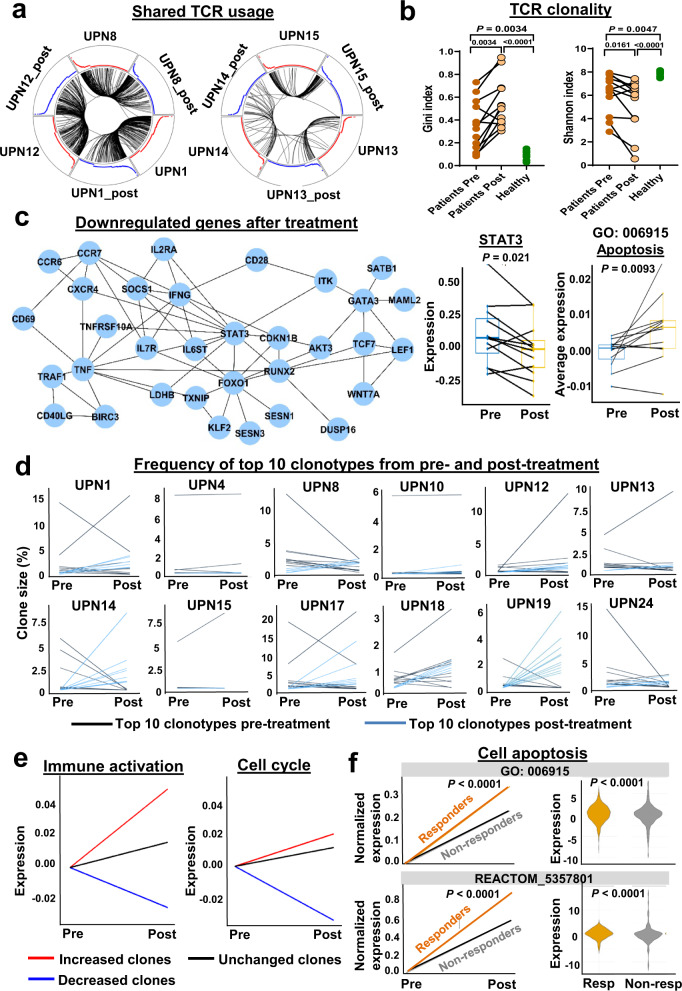
Fig. 6. Immunosuppressive treatment modulates clonality and gene expression in T-LGLL.
a Shown were circos plots, where segments in circles represent individual cells yielding rearranged TCR sequences among patients or between two visits of patients. Black lines indicate arcs connecting cells sharing identical CDR3 sequences. Left and right plots show sharing of identical CDR3 sequences among UPNs 1, 8, and 12, and UPNs 13, 14 and 15, respectively. Red and blue curves are proportional to clone sizes in samples before and after treatment, respectively. b Gini index and a Shannon index of TCR clonality were compared in patients (pre- and post-treatment) and with healthy donors. Gini index was still significantly higher (0.547 ± 0.215, P < 0.001) and Shannon index significantly lower (5.21 ± 2.25, P = 0.002) when compared with those of healthy controls. A two-sided Wilcoxon test between patients’ samples before and after treatment (n = 12); two-sided unpaired Mann–Whitney between patients (n = 13) and healthy donors (n = 7); P values shown in the figure. c A module of downregulated genes identified by jActiveModulesTopo in T-LGLL patients after treatment, including STAT3; dynamic changes of expression levels of STAT3 and apoptosis genes (GO: 006915) pre- and post-treatment in T-LGLL patients (n = 12). Shown are 25–75% response ranges (top and bottom lines of boxes) and minima and maxima (bars). P values with two-sided paired t-test were shown in figures. d Shown are percentages of top ten TCR clonotypes from pre- and post-treatment samples at different time points. Black lines indicate top ten clones pre-treatment; blue lines indicate top ten clones post-treatment those were not among top ten pre-treatment. e Expression changes of immune activation genes and cell cycle genes of increased, decreased and stable clones after alemtuzumab. f Left, expression changes of apoptosis genes (averaged) in responders and non-responders after treatment with alemtuzumab. x-axis, two time points, pre- and post-treatments; y-axis, adjusted expression levels of apoptosis genes to set pre-treatment values of apoptosis gene expression as zero in both responders and non-responders. Right, expression levels of apoptosis genes before treatment in responders (Resp) and non-responders (Non-resp); two-sided unpaired t-test; P < 0.0001 [as software generated P < 0.0001, exact P value not available].

