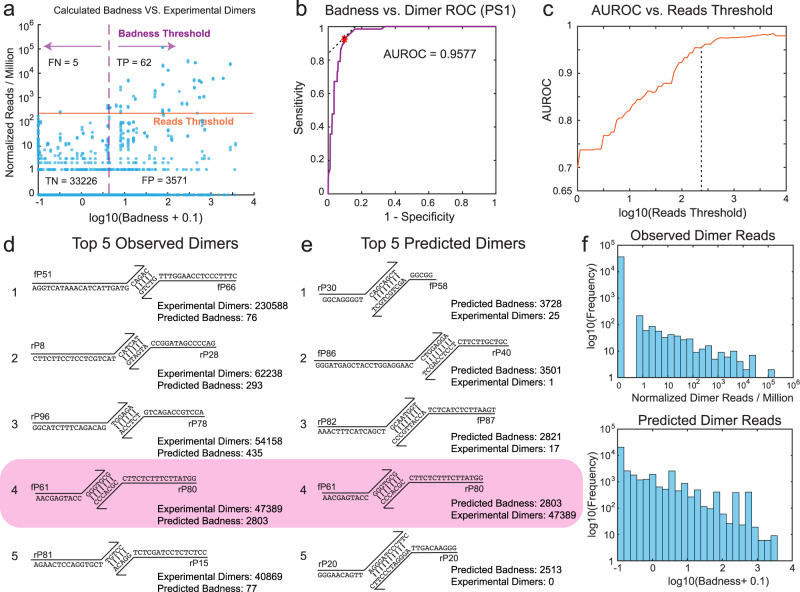
Fig. 4. Evaluation of prediction accuracy of the Badness function for individual primer dimer candidates.
a Comparison of observed vs. predicted primer dimers for all possible pairs of primers in the PS1 library. The horizontal orange line shows the mean on-target reads for the 96 intended amplicons. By changing the Badness Threshold, different tradeoffs of dimer prediction sensitivity and specificity can be achieved. For the current Reads Threshold and Badness Threshold, we observe 92.5% sensitivity and 90.3% specificity. b Receiver operator characteristic (ROC) curve for dimer prediction sensitivity and specificity achieved by changing the Badness Threshold. c The Area Under the ROC (AUROC) value depends on the Reads Threshold, with a highest achievable AUROC of about 0.98. d The top five dimer species experimentally observed to form with highest number of aligned NGS reads. e The top five potential dimer species predicted to form based on the Badness function. Note that only the #4 species are present are both list in panels d and e. f Distribution of observed NGS reads and predicted Badness for all possible primer dimers.

