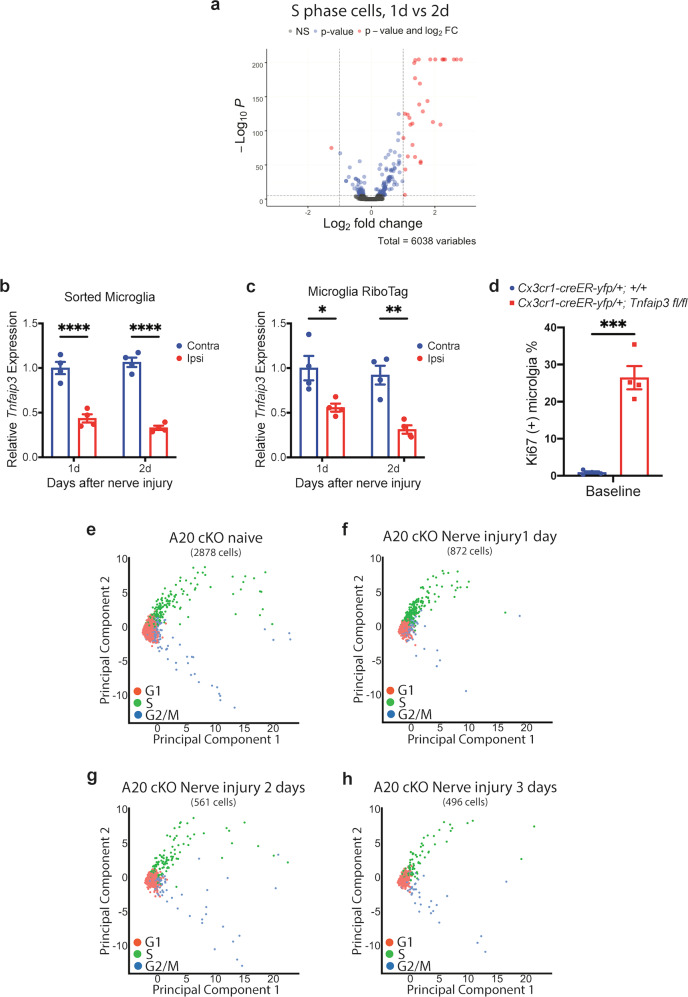
Fig. 3. Tnfaip3 is downregulated in microglia after nerve injury.
a Differential expression volcano plot of pseudobulk scRNA-Seq analysis. The S-phase microglia from day 1 after nerve injury displayed different gene expression profile from that of the S-phase microglia 2 days after nerve injury in Cx3cr1-creER-yfp/+; +/+ animals. b, c qRT-PCR of FACS-sorted microglia from lumbar spinal cord of Cx3cr1-creER-yfp/+; +/+ animals (b) and of RiboTag enriched microglia mRNA from lumbar spinal cord (c). Tnfaip3 was downregulated in the microglia of ipsilateral lumbar cord 1 and 2 days after nerve injury. d Quantification of proliferating Ki67 (+) microglia by flow cytometry. Naive uninjured Cx3cr1-creER-yfp/+; Tnfaip3 fl/fl A20 cKO animals had significantly more baseline microglia proliferation than those of naive control Cx3cr1-creER-yfp/+; +/+ animals. e scRNA-Seq PCA scatter plot of naive Cx3cr1-creER-yfp/+; Tnfaip3 fl/fl A20 cKO microglia. The distributions of G1, S, and G2/M phase cells were similar to that of Cx3cr1-creER-yfp/+; +/+ control animals 3 days after nerve injury as shown in Fig. 1d. f–h scRNA-Seq PCA scatter plot of Cx3cr1-creER-yfp/+; Tnfaip3 fl/fl A20 cKO microglia 1 day (f), 2 days (g), and 3 days (h) after nerve injury. The distributions of G1, S, and G2/M-phase cells were similar to that of naive Cx3cr1-creER-yfp/+; Tnfaip3 fl/fl A20 cKO animals (e). Analyses are two-way ANOVA with Sidak’s multiple comparison test (b, c) and unpaired two-tailed t-test (d), n = 4–6, means ± SEM, *P < 0.05, **P < 0.01, ***P < 0.001, and ****P < 0.0001.

