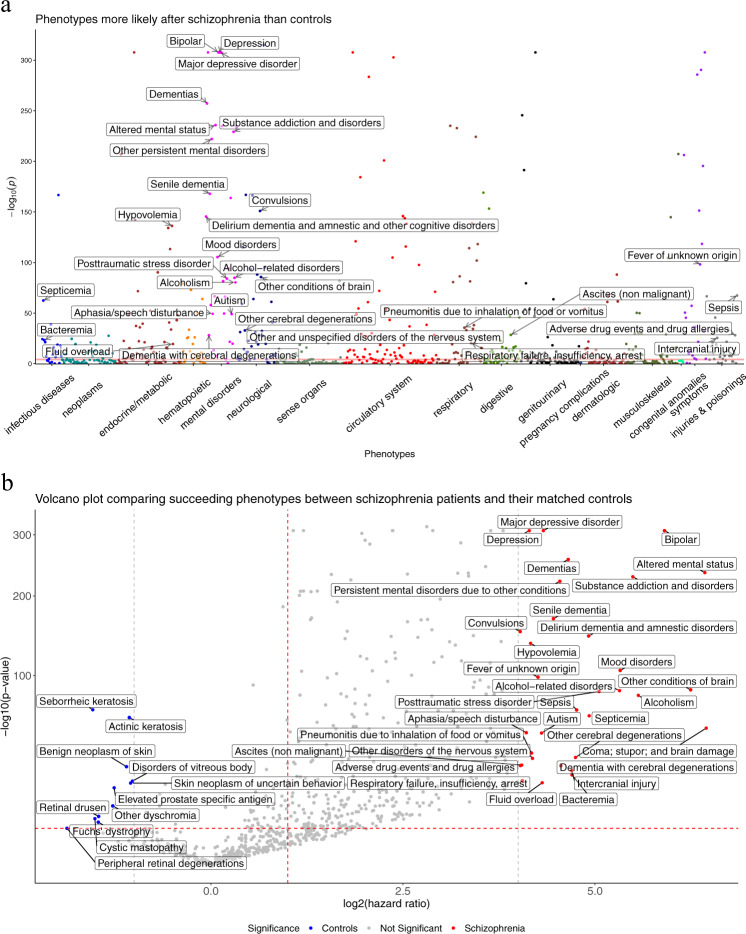
Fig. 2. Systematic analysis of the phenotypes following the clinical diagnosis of schizophrenia.
a Manhattan plot of the phenotypes. The red horizontal line indicates a Bonferroni-corrected P-value threshold. Annotated phenotypes have hazard ratios (HRs) ≥16. b Volcano plot of the phenotypes. The red horizontal dashed line indicates the same Bonferroni-corrected P-value threshold, the red vertical dashed line designates an HR = 1 threshold, and the gray vertical dashed lines indicate HR = 16 and HR = 0.5. Phenotypes with more extreme HRs are labeled in the figure.

