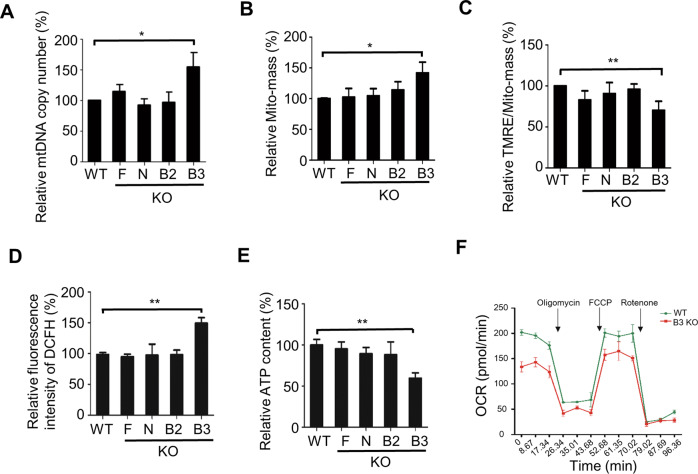
Fig. 2. BNIP3 protects mitochondrial homeostasis in mouse ESCs.
A Real-time PCR analysis of mtDNA in WT and mitophagy receptor knockout ESCs. Data are shown as mean ± SD, n = 3; *P < 0.05; Student’s t test. B Analysis of mitochondrial mass (Mito-mass) in WT and mitophagy receptor knockout ESCs. MitoTracker Green was used for Mito-mass detection. Data are shown as mean ± SD, n = 3; *P < 0.05; Student’s t test. C Mitochondrial membrane potential of WT and mitophagy receptor knockout ESCs. Data are shown as mean ± SD, n = 3; **P < 0.01; Student’s t test. D ROS generation in WT and mitophagy receptor knockout ESCs. Data are shown as mean ± SD, n = 3; **P < 0.01; Student’s t test. E ATP generation in WT and mitophagy receptor knockout ESCs. Data are shown as mean ± SD, n = 3; **P < 0.01; Student’s t test. F Oxygen consumption rates (OCRs) of WT and Bnip3−/− ESCs treated sequentially with oligomycin, FCCP, and rotenone.

