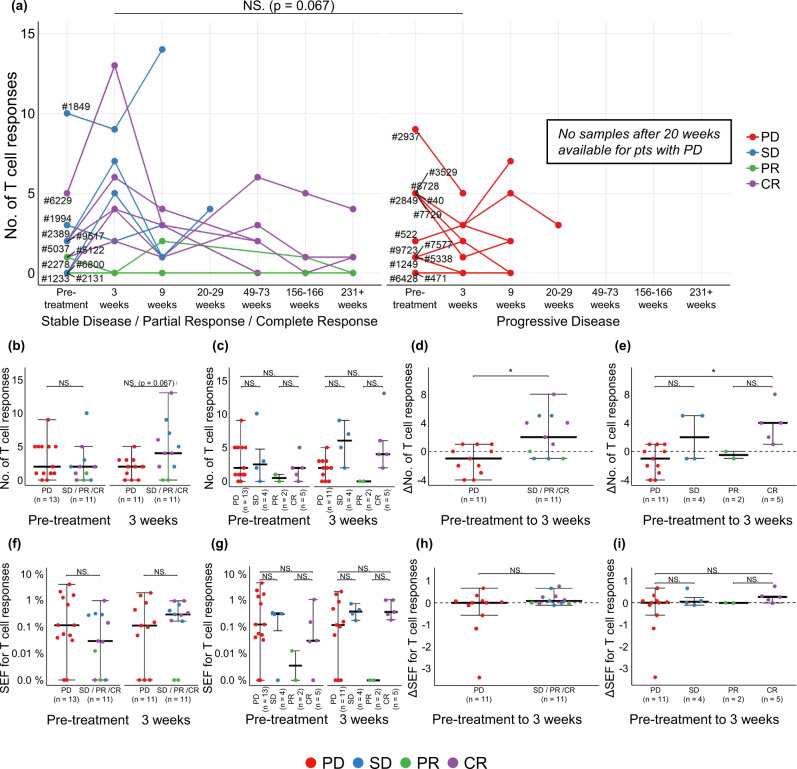
Fig. 3. Impact of NARTs in ICB.
a No. of detected NART responses for all patients over course of therapy. Filled circles at respective time points indicate screening of the given sample. Patients are clustered according SD, PR, and CR (n = 11 patients) and with PD (n = 13 patients). b–c Number of detected NART responses prior to treatment (n = 24 patients) and at three weeks post-treatment (n = 22 patients) for each patient, d–e the change in number of NART responses between pre- and 3 weeks post-treatment for patients with minimum two time points sampled (n = 22 patients), f–g SEF for NART populations at pre- and at 3 weeks post-treatment, and (h–i) change in SEF for NART populations between pre- and three weeks post-treatment, in all figures evaluated as PD compared to SD/PR/CR patients or individual Best RECIST 1.1 groups. For (b), (d), (f) + (h) groups were compared using non-parametric two-sided Mann–Whitney test and Kruskal–Wallis Dunn’s multiple comparison test for (c), (e), (g) + (i). For (b–i), data is presented as median values ± largest/smallest value within upper/lower quartile ± 1.5 IQR. NS. Not Significant, *p < 0.05. Source data are provided as a Source Data file.

