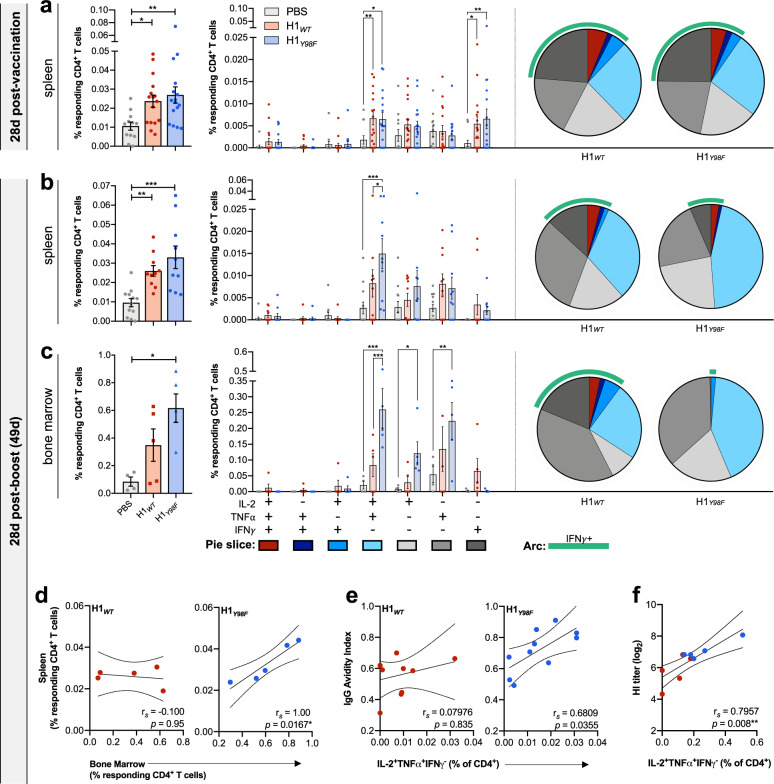
Fig. 4. H1Y98F-VLP elicits robust CD4+ T cell responses with enhanced recruitment of antigen-specific CD4+ T cells to the bone marrow.
Splenocytes and BM immune cells were stimulated for 18 h with 2.5 µg/ml H1WT-VLP. Flow cytometry was used to quantify H1-specific CD4+ T cells in a splenocytes isolated at 28 days post-vaccination (3 µg) and in b splenocytes and c BM immune cells at 28 days post-boost (0.5 µg/dose). Background values obtained from non-stimulated samples were subtracted from values obtained following stimulation with H1WT-VLP. a–c The left panel shows the mean frequency (±SEM) of CD4+ T cells expressing CD44 and at least one of IL-2, TNFα or IFNγ. The right panel shows the individual cytokine signatures of responding CD4+ T cells obtained by Boolean analysis. Color-matched pie charts depict relative distributions of cytokine-producing CD4+ T cell populations and IFNγ+ populations are highlighted by a green arc. Statistical significance was determined by Kruskal–Wallis test with Dunn’s multiple comparisons (total response) or two-way ANOVA with Tukey’s multiple comparisons (cytokine signatures) (*p < 0.033, **p < 0.01, ***p < 0.001). Spearman’s rank correlation technique was applied to evaluate the relationship between (d) the frequency of H1-specific CD4+ T cells in the spleen and BM, e the frequency of IL-2+TNFα+IFNγ- CD4+ T cells in the spleen and IgG avidity index (4 M urea) and f the frequency of IL-2+TNFα+IFNγ− CD4+ T cells in the BM and HI titer (*p < 0.033, **p < 0.01).

