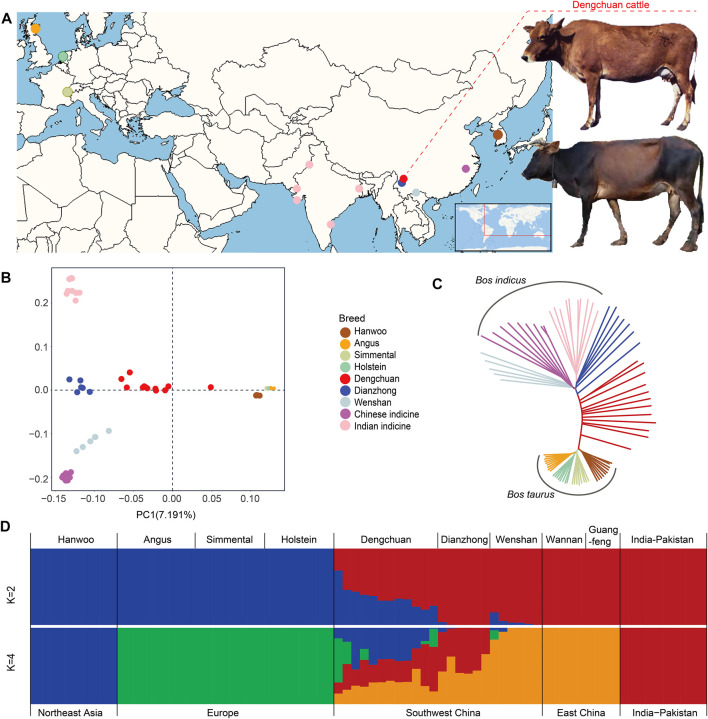
FIGURE 1.
Population genetic analysis of Dengchuan cattle. (A) Geographic map indicating the origins of Dengchuan cattle and other cattle analyzed in this study. (B) Principal component analysis of cattle with PC1 against PC2. (C) Neighbor-joining tree of the 78 domesticated cattle. (D) Admixture plot (K = 2, 4) for the 78 cattle individuals. Each individual is shown as a vertical bar divided into K colors.

