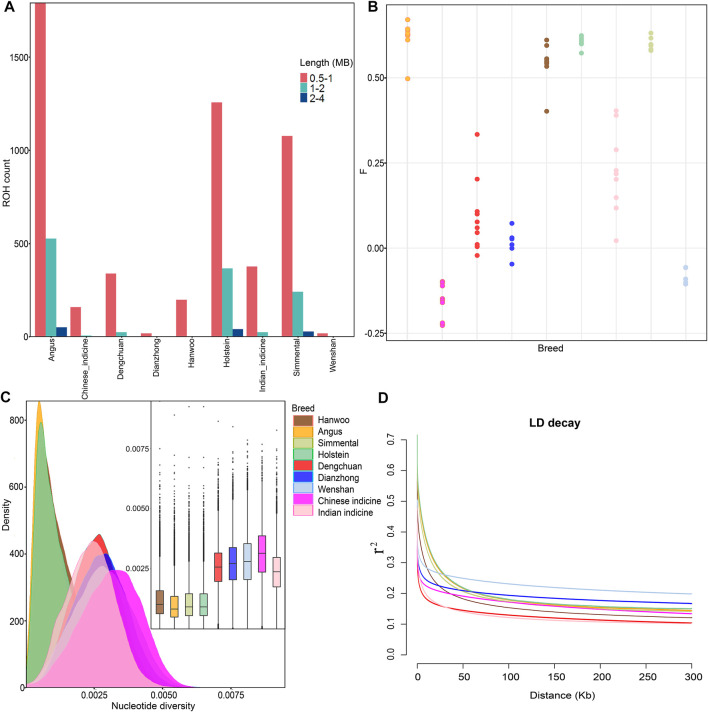
FIGURE 2.
Genetic diversity among 78 samples from nine populations. (A) Estimation of the total number of ROH for each group. The three categories of ROH length: 0.5–1 Mb, 1–2 Mb, and 2–4 Mb, reflecting ancient, historical, and recent inbreeding, respectively. (B) Inbreeding coefficient for each individual. (C) Density plots and Box plots of the nucleotide diversity for each group. (D) Genome-wide average LD decay estimated from each group.

