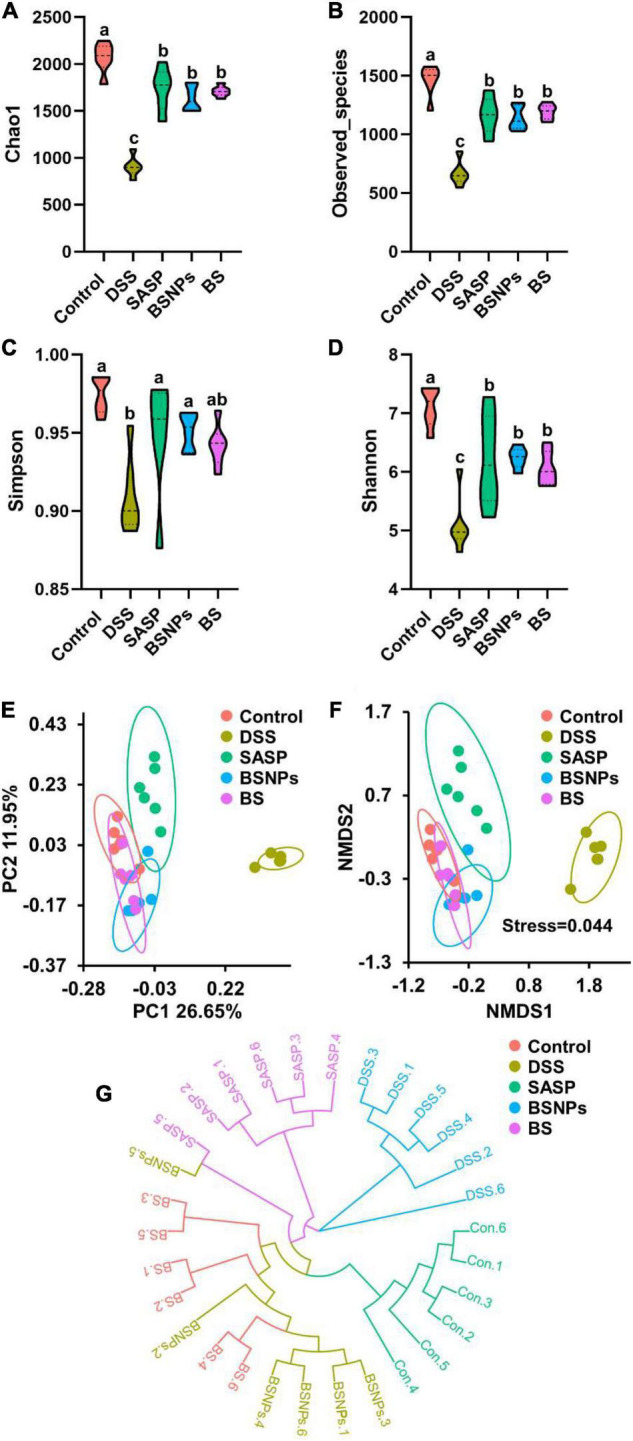
FIGURE 3.

Analysis of the alpha diversity and beta diversity of the differential microbial community among the control group, DSS group, SASP, BS, and BSNPs-treated group. Violin plots showing Chao1 index (A), Observed_species index (B), Simpson index (C), Shannon index (D). (E) UniFrac distance of unweighted PCoA analysis, (F) UniFrac distance of unweighted NMDS analysis, (G) the unweighted pair-group technique with arithmetic mean (UPGMA) analysis the differences between samples. Means without a common letter are significantly different at p < 0.05 using one-way ANOVA followed by Tukey’s test for post hoc analysis.
