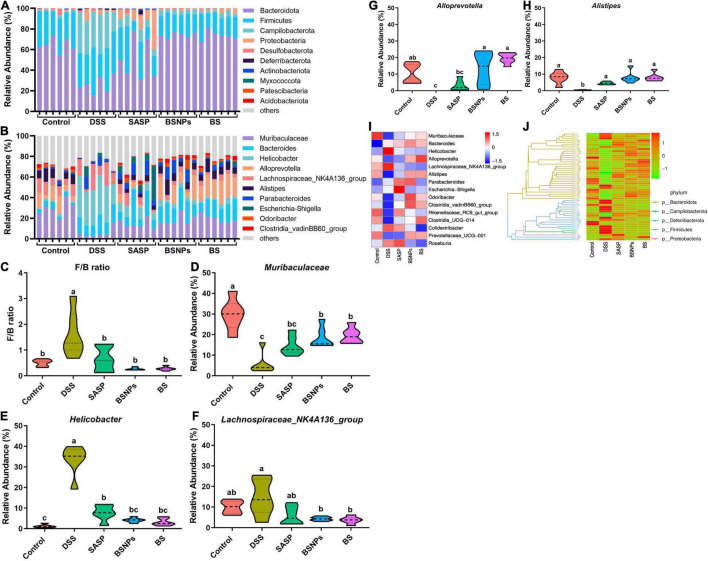
FIGURE 4.
Analysis of the microbial community structure of each group. (A) Relative abundance of each sample at the phylum level. (B) Relative abundance of each sample at the genus level. Violin plots showing Firmicutes to Bacteroidetes ratio (F/B ratio) (C) of each group, and relative abundance of Muribaculaceae (D), Helicobacter (E), Lachnospiraceae_NK4A136_group (F), Alloprevotella (G), and Alistipes (H) at the genus levels. (I) Heatmap illustrating the relative abundance of the 15 most abundant bacterial genus. (J) Phylogenetic tree and heatmap showing relative abundances of operational taxonomic units (OTUs) together with a corresponding phylogenetic tree. The clustering branch represents different bacterial phyla. The abundance graph was shown on the right, which corresponds to the abundance of left OTUs in each sample. Means without a common letter are significantly different at p < 0.05 using one-way ANOVA followed by Tukey’s test for post hoc analysis.

