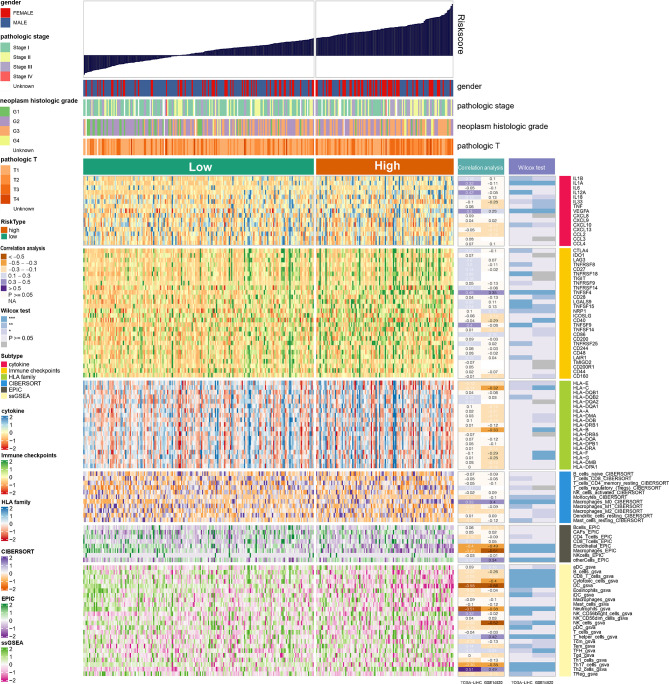
Figure 5.
Landscape of cytokine, immune checkpoints, HLA family genes, and immune cell infiltrations in the low- and high-NRS groups. Correlation analysis for NRS and expression and immune infiltration. Wilcox tests were used to detect the difference in genes expression and immune infiltration between low- and high-NRS groups. *p<0.05, **p<0.01, ***p<0.001.

