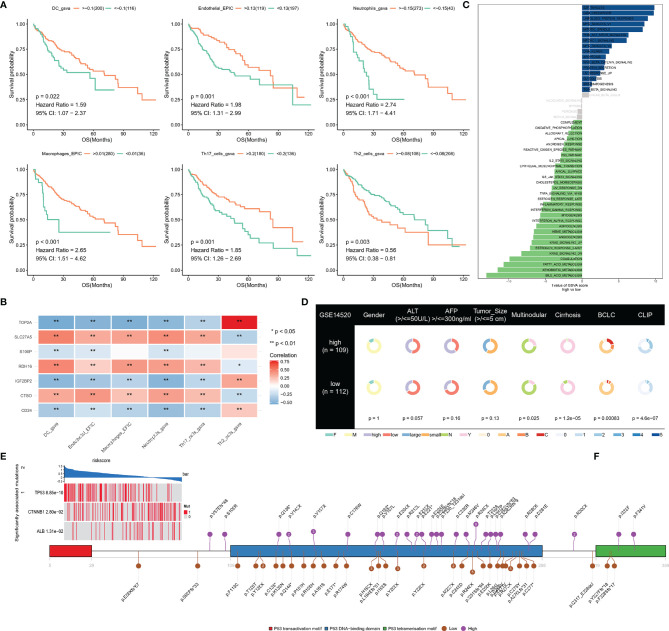
Figure 6.
(A) Survival analysis of immune cells; (B) The correlation between signatures and immune cells; (C, D) Difference of hallmark pathways and clinical phenotypes between low- and high-NRS groups; (E) Mutant genes that are statistically different between low- and high-NRS groups; (F) mutation sites of TP53 in high- and low-NRS groups are independently summarized. *p<0.05, **p<0.01.

