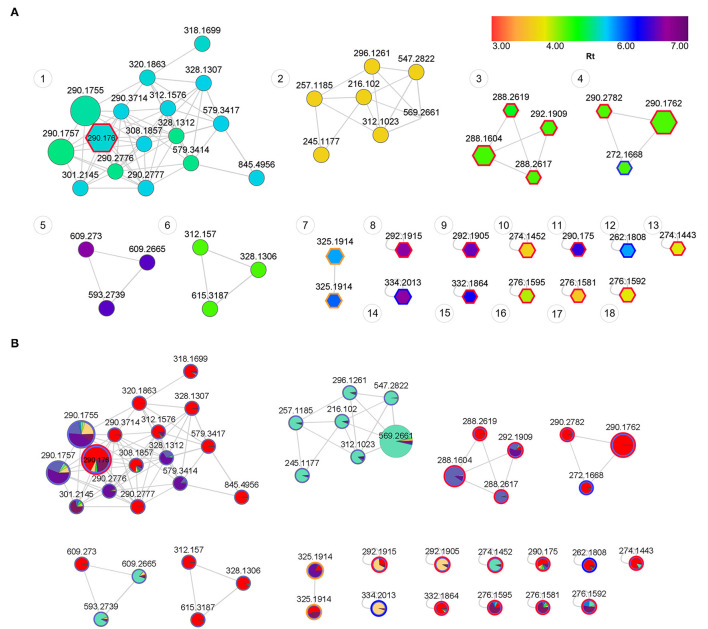
Figure 6.
(A) Feature-based molecular network of Sceletium populations showing structural trends. Annotated nodes with pentagon boarders represent putatively identified metabolites (Table 2). Red outlines represent the mesembrine alkaloids, blue outlines represent joubertiamine alkaloids and orange outlines represent Sceletium A4 alkaloid class. Nodes are colored by retention time (RT) with their size representing the abundance of the metabolite. The distance between nodes indicates structural similarity based on fragmentation patterns from tandem mass spectrometry data. (B) Feature-based molecular network of Sceletium populations showing phytochemical distribution trends across populations. Red: S. tortuosum (De Rust); Blue: S. strictum (Anysberg); Green: S. expansum (Calitzdorp) and Purple: S. rigidum (Prince Albert).

