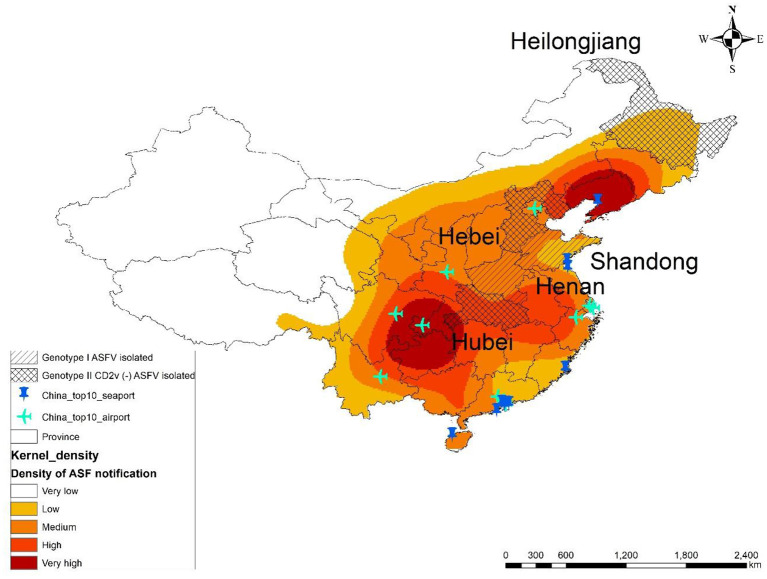
Figure 3.
Density of ASF notifications in China overlapped with the lower virulent ASFV reported area and China's 10 largest airports and seaports. The graduated color shades illustrate the estimated kernel density of ASF notifications (notifications/km2). Each colored area indicates frequency of ASF notification number per >4.61 × 10⁻⁵ (very high), 3.11 × 10⁻⁵ to 4.6 × 10⁻⁵ (high), 1.81 × 10⁻⁵ to 3.1 × 10⁻⁵ (medium), 6.9 × 10⁻⁶ to 1.8 × 10⁻⁵ (low), and <6.9 × 10⁻⁶ (very low). Provinces where ASFV genotype I and CD2v (–) ASFV genotype II were isolated are represented by a diagonal line and a grid line, respectively. The locations of China's 10 largest airports and seaports are represented by airplane and pin symbols, respectively.

