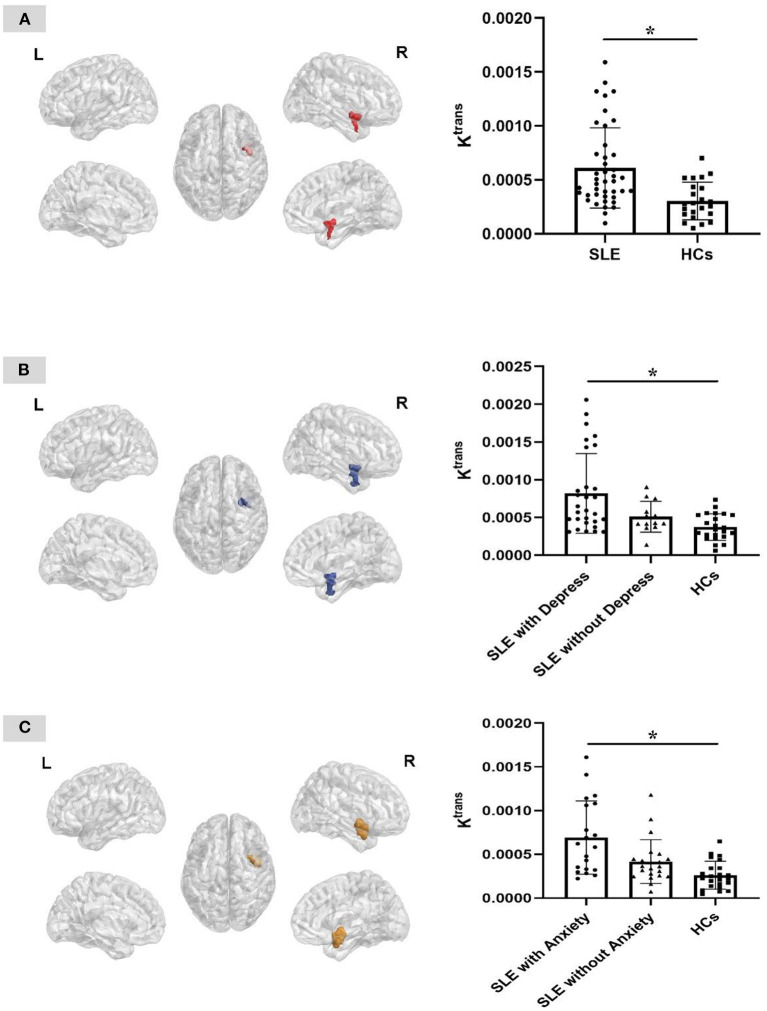
Figure 1.
Three-dimensional plane view of the area with different Ktrans value between groups. (A) The right insular region presents significantly higher Ktrans value in the SLE group than that of the HC group. (B) The right insular region presents significantly higher Ktrans value in the SLE patients with depression group than that of the patients without depression and the HC group. (C) The right insular region presents significantly higher Ktrans value in the SLE patients with anxiety group than that of the patients without anxiety and the HC group. *P = 0.005, cluster size > 100. L, left; R, right.

