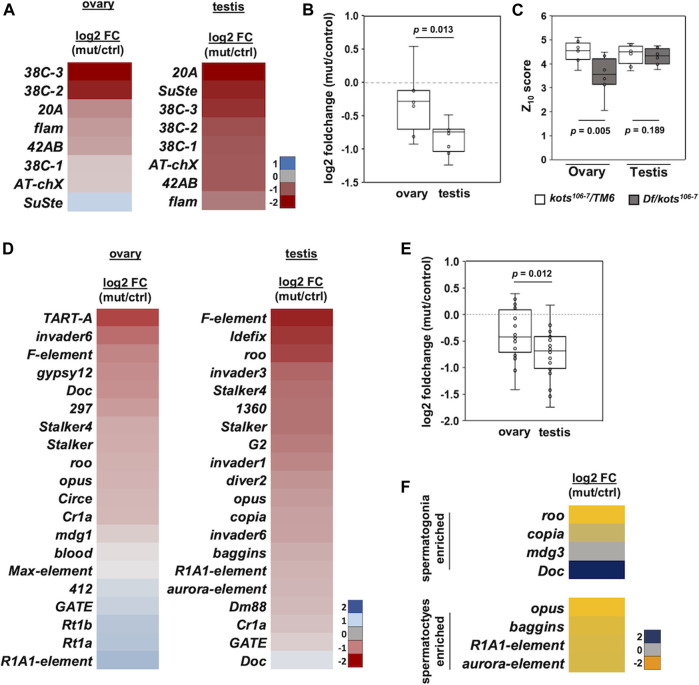
FIGURE 4.
piRNAs mapping to canonical piRNA clusters and transposons are downregulated in kots mutants. (A) Log2 fold change (mutant/control) of piRNAs mapping to 8 major clusters in mutant and control gonadal samples. (B) Downregulation of cluster-mapping piRNAs is more severe in testes than that in ovaries (t-test, p-value 0.013). (C) Boxplot showing Z10 score of piRNAs mapping to clusters in ovaries and testes (t-test, p-values 0.005 and 0.189, respectively). (D) Log2 fold change of top 20 most abundant TE-mapping piRNAs. (E) Comparison of the top 20 most abundant TE-mapping piRNAs in ovaries and testes (t-test, p-value 0.012). (F) Log2 fold change in abundance of piRNAs mapped to TEs enriched in spermatogonia and spermatocytes.

