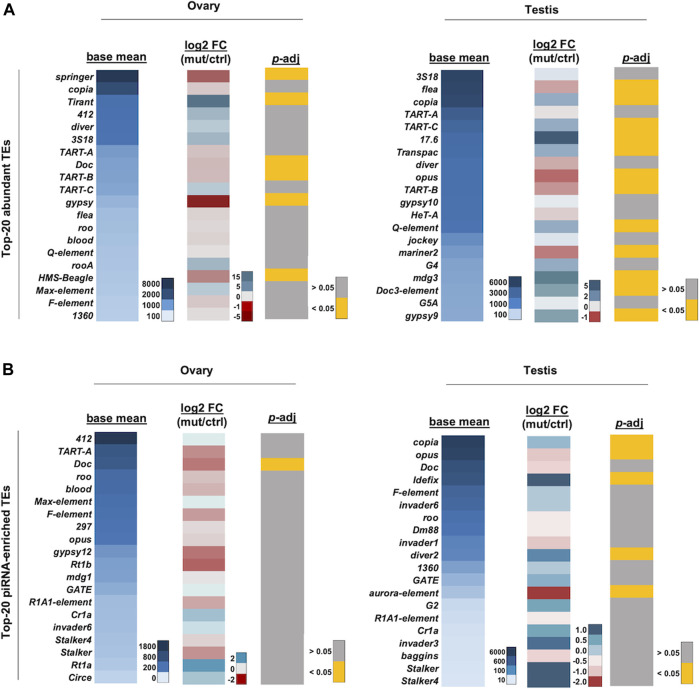
FIGURE 5.
TE expression profile in kots mutant gonads. (A) Heatmaps showing the averaged read counts between the control and mutant (left panel), log2 fold change (mutant/control; middle panel), and p-adjusted values (right panel) of the top 20 most abundant TE mRNAs in ovaries and testes, respectively. (B) Heatmaps as in (A) showing corresponding values for the top-20 piRNA-enriched TEs.

