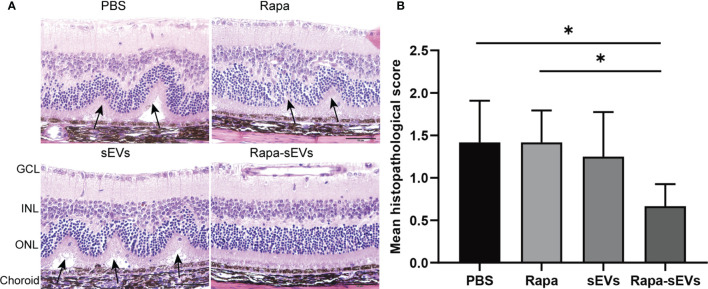
Figure 6.
Histological assessment of the retina in EAU. (A) Representative H&E staining images of PBS, Rapa, sEV, and Rapa-sEV treated groups. The black arrows represented the retinal folds and detachments near the optic disk. GCL, ganglion cell layer; INL, inner nuclear layer; ONL, outer nuclear layer. (B) Results are expressed quantitatively as histopathological scores. Values are expressed as the mean ± SD of six mice (6 eyes) per group. *P < 0.05, Kruskal-Wallis test.

