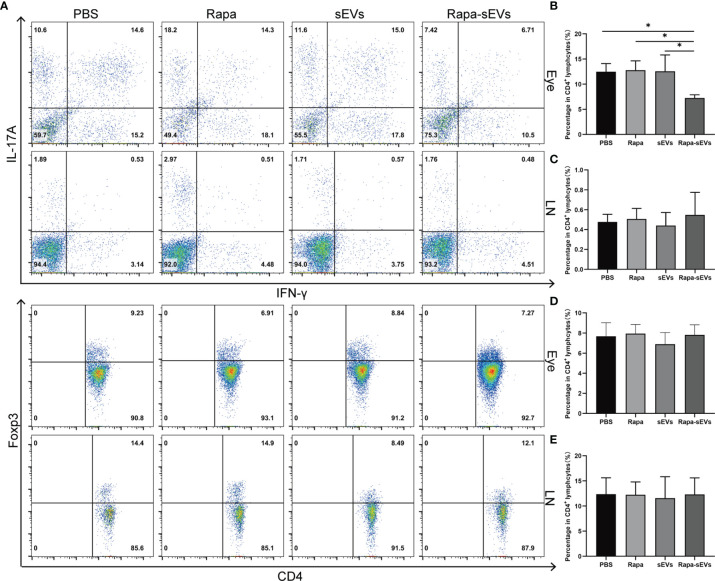
Figure 7.
Analysis of T cell subsets from eye and lymph node in EAU. (A) Representive figures of intracellular staining of IFN-γ+IL-17+, Foxp3+ in eyes and lymph nodes derived CD4+T cells from PBS, Rapa, sEV, and Rapa-sEV treated mice with EAU. (B) The percentage of CD4+IFN-γ+IL-17+ cells in eyes. (C) The percentage of CD4+IFN-γ+IL-17A+ cells in cervical draining lymph nodes. (D) The percentage of CD4+Foxp3+ cells in eyes. (E) The percentage of CD4+Foxp3+ cells in cervical draining lymph nodes. Values are expressed as the mean ± SD of three mice per group. *P < 0.05, one-way ANOVA.

