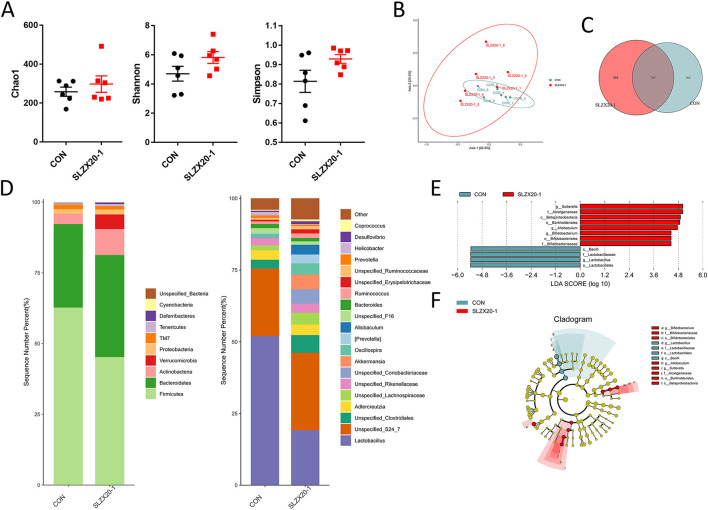
Figure 6.
Effects of L. amylovorus SLZX20-1 microbial composition of colon. (A) The α-diversity comparisons were analyzed by Chao1, Shannon's diversity, and Simpson index, data were shown as mean ± SEM. (B) The β-diversity comparisons were analyzed by weighted UniFrac PCoA. (C) Common species analysis was shown by the Venn diagram. (D) Community composition of the gut microbiota at the phylum and genus levels. (E) Bacterial taxa differentially were identified by LEFSe using an LDA score threshold of >2.0 and p < 0.05. (F) LEfSe cladogram of microbial composition in colon of control and L. amylovorus SLZX20-1-treated mice (LDA score >2, p < 0.05), red and gray nodes/shades indicate taxa that are significantly higher in relative abundance. The diameter of each node is proportional to the taxon's abundance, CON, and SLZX20-1 mean control and L. amylovorus SLZX20-1 (1 × 10⁹ CFU/ml) -treated mice, respectively.

