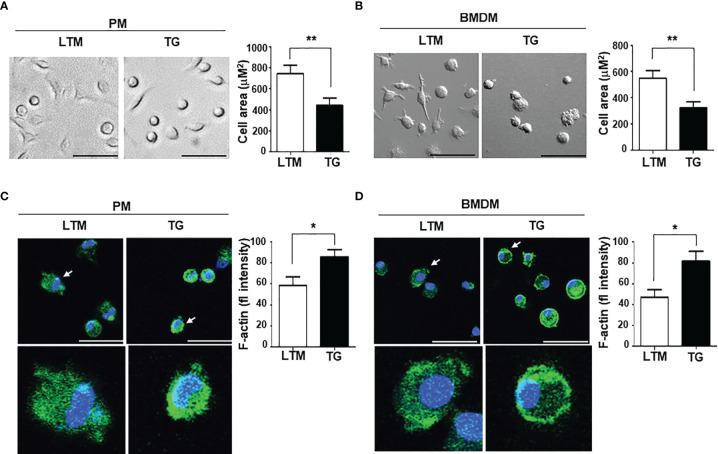
Figure 2.
Morphological characteristics associated with p190RhoGEF transgene expression in TG macrophages. (A, B) Morphological comparison of PMs and BMDMs from LTM and TG mice. Scale bars = 50 μm. Cellular area was measured in each experiment and the data were compared as the mean ± SEM. Statistical significance was analyzed by unpaired t tests. Significant comparisons are noted as **p < 0.01. (C, D) Actin and nuclei staining with FITC-phalloidin (green) and DAPI (blue), respectively, in PMs and BMDMs from LTM and TG mice. All are merged images of actin staining and DAPI. Scale bars = 50 μm. An enlarged image of single cell (indicated by an arrow) is also shown. Green fluorescence (fl) intensities of cells in each experiment were analyzed and the data were compared as the mean ± SEM. Statistical significance was analyzed by unpaired t tests. Significant comparisons are noted as *p < 0.05. All data are representative of five separate experiments.

