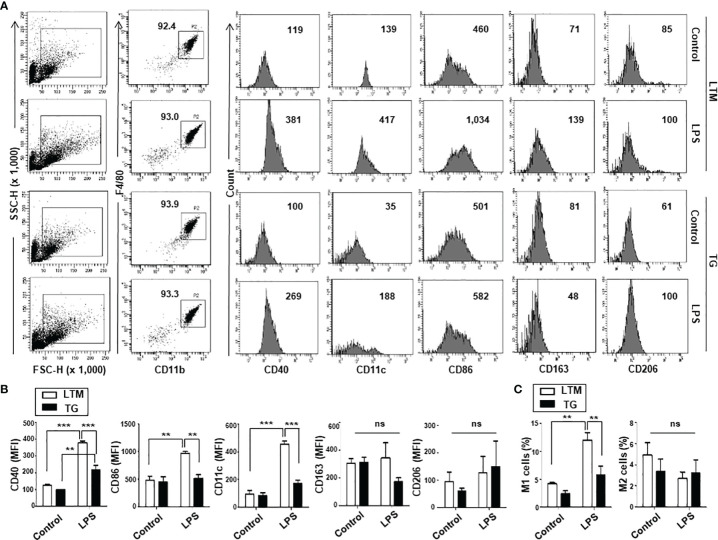
Figure 3.
Macrophage subset populations in LTM and TG mice. Analyses of subset populations of PMs from LTM and TG mice in normal conditions and during peritoneal inflammation caused by LPS. PMs were labeled with FITC- or APC-conjugated anti-CD11c, FITC-conjugated anti-CD40 or anti-CD86, BV421- or APC-conjugated CD163, APC-conjugated CD206 mAbs in color combinations, along with mAbs for PE-conjugated CD11b and PerCP-conjugated F4/80. Four-color flow cytometric analyses were then conducted. (A) Representative results are presented as dot plots, showing F4/80 vs. CD11b staining, and the percentages of the total cells that they represent are indicated. The expression of M1 markers (CD40, CD11c, CD86) and M2 markers (CD163, CD206) of CD11b+F4/80+ cells is shown as the mean fluorescence intensity (MFI) of each marker. (B) The MFI of each marker is compared and the data from three independent experiments are presented as the mean ± SEM. Statistical significance was analyzed by one-way ANOVA with Tukey’s multiple comparison tests. Significant comparisons are noted as **p < 0.01, ***p < 0.001, ns, not significant. (C) Changes in the M1/M2 subset population during peritoneal inflammation caused by LPS were compared as the percentage of CD11b+F4/80+ cells expressing CD11c (M1) and the percentage of CD11b+F4/80+ cells expressing CD163 (M2). Data shown are the mean ± SEM of three separate analyses. Significance was determined by one-way ANOVA with Tukey’s multiple comparison tests (**p < 0.01, ns, not significant).

