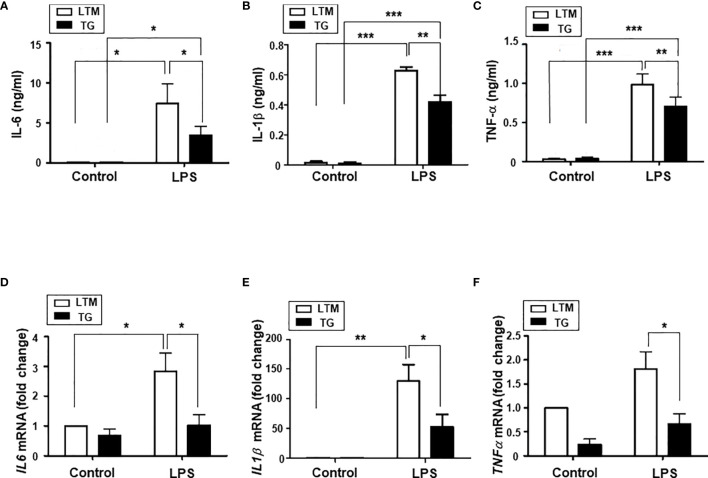
Figure 6.
Analyses of inflammatory cytokine production in the PMs of LTM and p190RhoGEF TG mice. PMs from LTM control and TG mice were cultured in the medium alone (control) or with LPS (100 ng/ml) overnight. For IL-1β ELISA, cells were stimulated with ATP (2 mM) for 1 hour after 3-hour LPS (100 ng/ml) treatment. (A–C) The levels of IL-6, IL-1β, and TNF-α in the supernatants were compared by ELISA. The data are the mean ± SEM of three independent experiments with triplet sample settings. Statistical significance was analyzed by one-way ANOVA with Tukey’s multiple comparison tests. Significant comparisons are noted as *p < 0.05, **p < 0.01, ***p < 0.001. (D–F) Messenger RNA transcripts of IL-6, IL-1β, and TNF-α were compared by quantitative real-time PCR analysis, as described in Materials and Methods. The relative level of expression is shown compared with the expression level of LTM control PM cells. Data are the mean ± SEM of four separate experiments. Significance was determined by one-way ANOVA with Tukey’s multiple comparison tests. Significant comparisons are noted as *p < 0.05, **p < 0.01.

