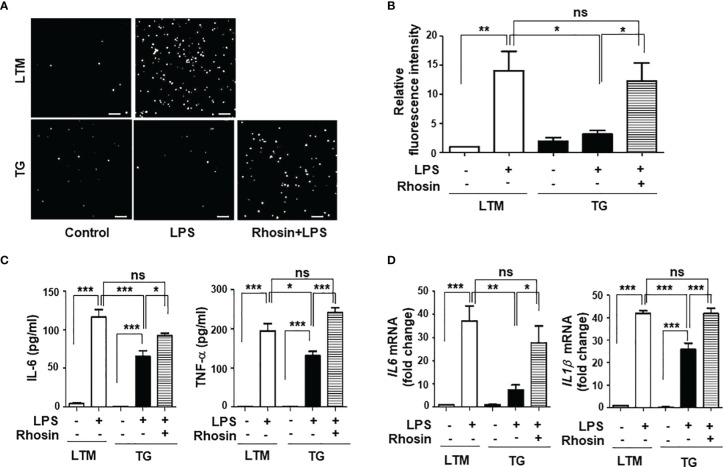
Figure 8.
Functional changes in p190RhoGEF TG macrophages caused by the inhibition of RhoA. TG PMs were pre-treated with an inhibitor of RhoA, rhosin (1 μM) for 1 hour. (A, B) LPS-mediated ROS production was compared as described in Figures 4A, B. Representative images (scale bars = 50 μm) (A) and the DCF fluorescence intensity (B) of PMs from LTM and TG mice after a 30-minute stimulation with LPS (1 μg/ml) are shown. The data from three different experiments are presented as the mean ± SEM. Statistical significance was analyzed by one-way ANOVA with Tukey’s multiple comparison tests. Significant comparisons are noted as *p < 0.05, **p < 0.01, ns, not significant. (C, D) PMs from LTM control and TG mice were incubated in medium alone (control) or with LPS (1 μg/ml) for 1 hour. The levels of IL-6 and TNF-α in the supernatants were compared by ELISA (C). The data are the mean ± SEM of three independent experiments with triplet sample settings in each experiment. Statistical significance was analyzed by one-way ANOVA with Tukey’s multiple comparison tests. Significant comparisons are noted as *p < 0.05, ***p < 0.001, ns, not significant. Messenger RNA transcripts of IL-6 and IL-1β were compared by quantitative real-time PCR analysis (D). The relative level of expression is compared with the expression level in LTM control PM cells. Data are the mean ± SEM of three separate experiments. Statistical significance was analyzed by one-way ANOVA with Tukey’s multiple comparison tests. Significant comparisons are noted as *p < 0.05, **p < 0.01, ***p < 0.001, ns, not significant.

