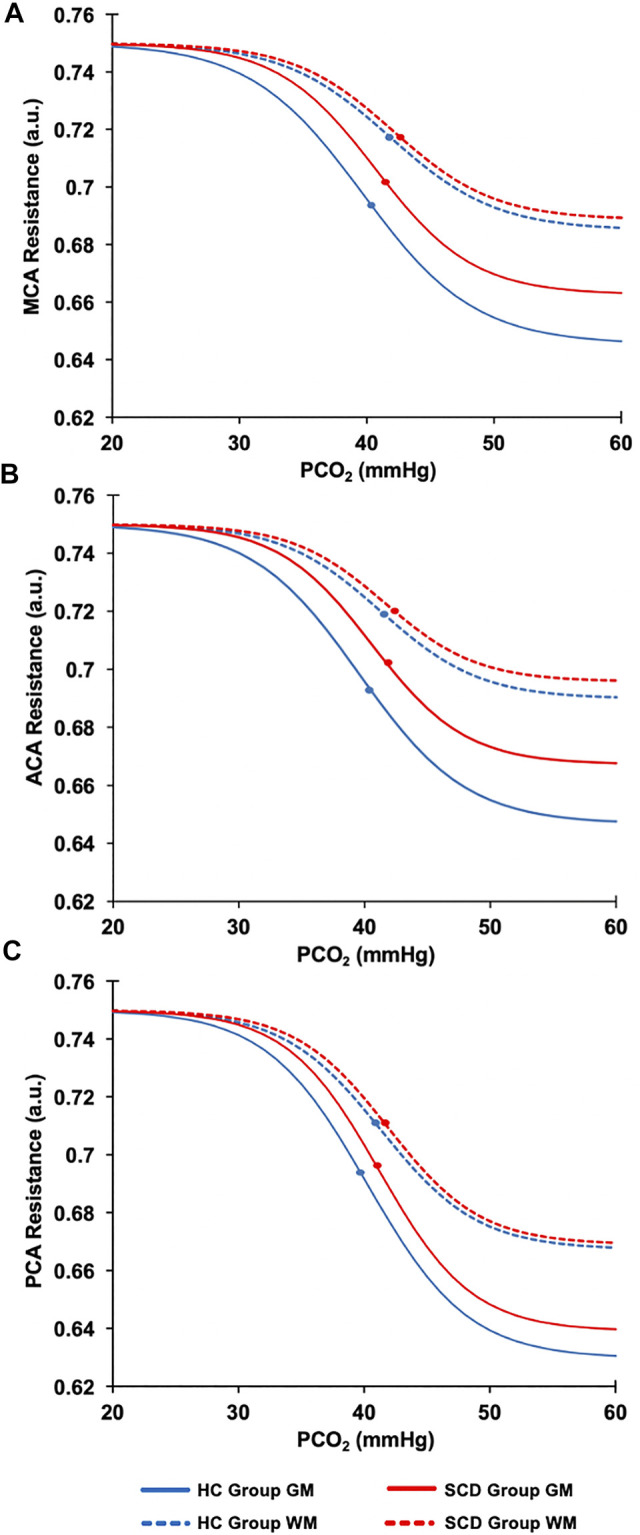
FIGURE 4.

The resistance sigmoidal curves for the HC (blue line) and the SCD patient (red line) groups in GM (solid lines) and WM (dashed lines) calculated from the mean values of the resistance sigmoid parameters. (A) The MCA sigmoid curves for the GM and WM for HC and SCD patient groups. (B) The ACA sigmoid curves for the GM and WM for HC and SCD patient groups. (C) The PCA sigmoid curves for the GM and WM for HC and SCD patient groups. The dots on each sigmoid curve represent the resistance reserve (from the dot to the lowest resistance).
