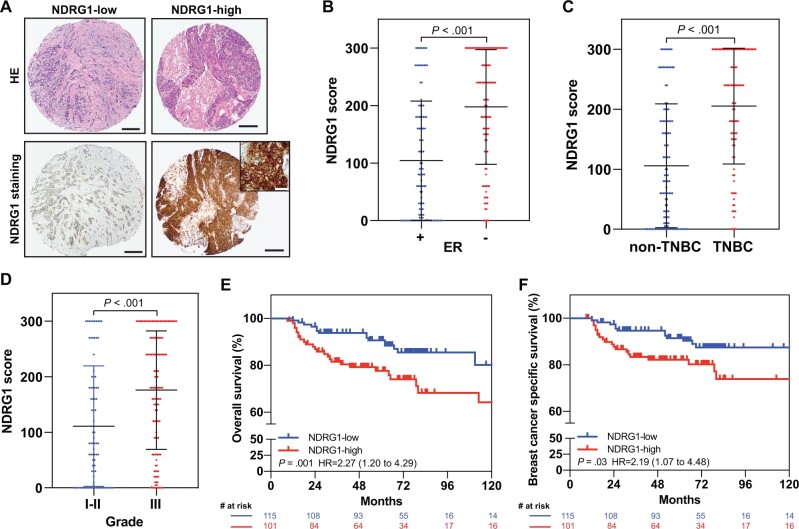
Figure 6.
Prognostic significance of NDRG1 in patients with breast cancer. A) Representative photomicrographs of NDRG1 expression in tissue microarrays from breast cancer patients; left, an invasive breast carcinoma with weak and focal staining for NDRG1; right, another invasive breast carcinoma with strong and diffuse staining for NDRG1. Scale bar = 200 µm. Inset, high-magnification photomicrograph shows cytoplasmic and membranous NDRG1 staining in tumor cells. Scale bar = 50 µm. NDRG1 expression according to (B) estrogen receptor, (C) triple-negative breast cancer (TNBC), and (D) grade status. Horizontal lines indicate medians and error bars indicate SD; P values from 2-sided Mann-Whitney tests. Kaplan-Meier estimates of (E) overall survival and (F) breast cancer–specific survival according to NDRG1 expression. P values from log-rank tests, and the hazard ratio with 95% confidence interval (95% CI) is shown. ER = estrogen receptor; HR = hazard ratio.

