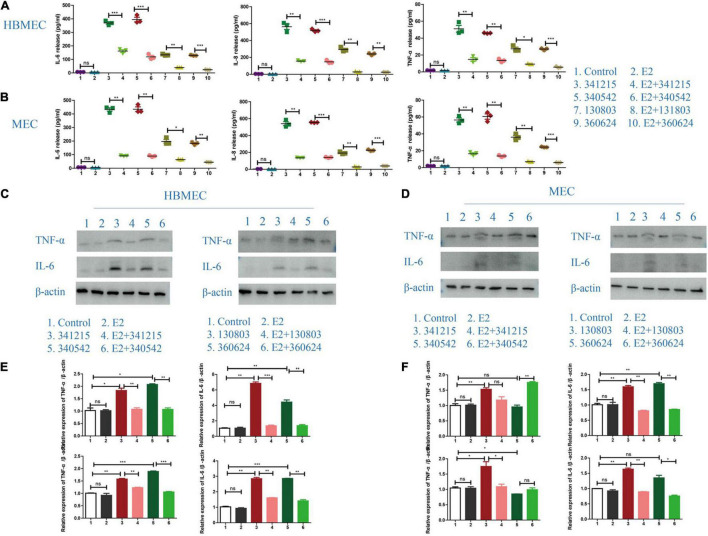
FIGURE 2.
Inflammatory cytokines release in Neisseria meningitidis-infected cells after E2 treatment. (A,B) HBMECs (A) and MECs (B) were treated with N. meningitidis infection and N. meningitidis infection after E2 pretreatment. Cells without N. meningitidis infection and the cells stimulated by E2 only were used as controls. ELISA assays were used to detect the expression of inflammatory factors IL-6, IL-8, and TNF-α in the culture supernatant. (C–F) HBMECs (C) and MECs (D) were treated as above. Western blotting was used to detect the levels of TNF-α and IL-6, with β-actin used as a loading control. The levels of the above molecules in both cells was analyzed by Image-J software, and the gray analysis value was analyzed statistically using Graph-pad Prism software. NS (not significant) is P > 0.05, *P < 0.05, **P < 0.01, ***P < 0.001.

