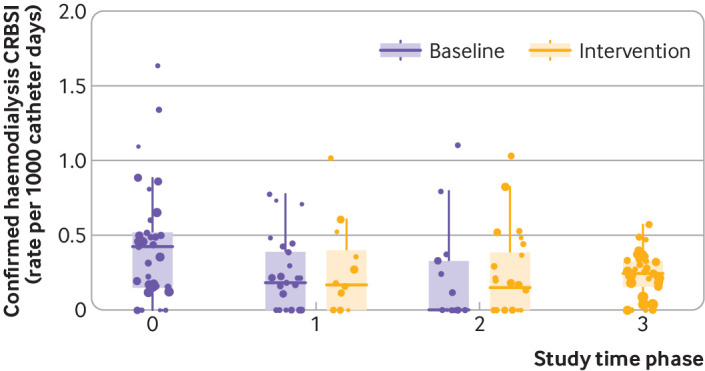
Fig 2.

Box plot of raw rate of confirmed haemodialysis catheter related bloodstream infection (CRBSI) per 1000 catheter days, at service level, across the study. Time points are defined: 0 is all services in baseline phase; 1 is first tranche (12 services) of intervention implemented; 2 is second tranche implemented with total of 24 services in intervention phase; 3 is final tranche implemented with all services in intervention phase. Dots are weighted to size of renal services (according to local dialysis registry). Box represents interquartile range and line represents median rate during trial phase
