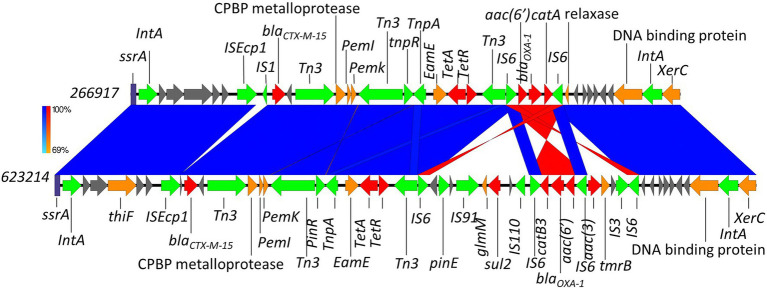
Figure 8.
Chromosomal integration of blaCTX-M-15 comparison between isolates 623214 and 266917. Arrows indicate gene direction while colours indicate gene function. Hypothetical proteins are shown in grey; AMR determinants are shown in red; mobile elements are shown in green; and other genes are shown in orange. Scale bars indicate level of sequence similarity for forward (blue) and reverse (red) sequences.

