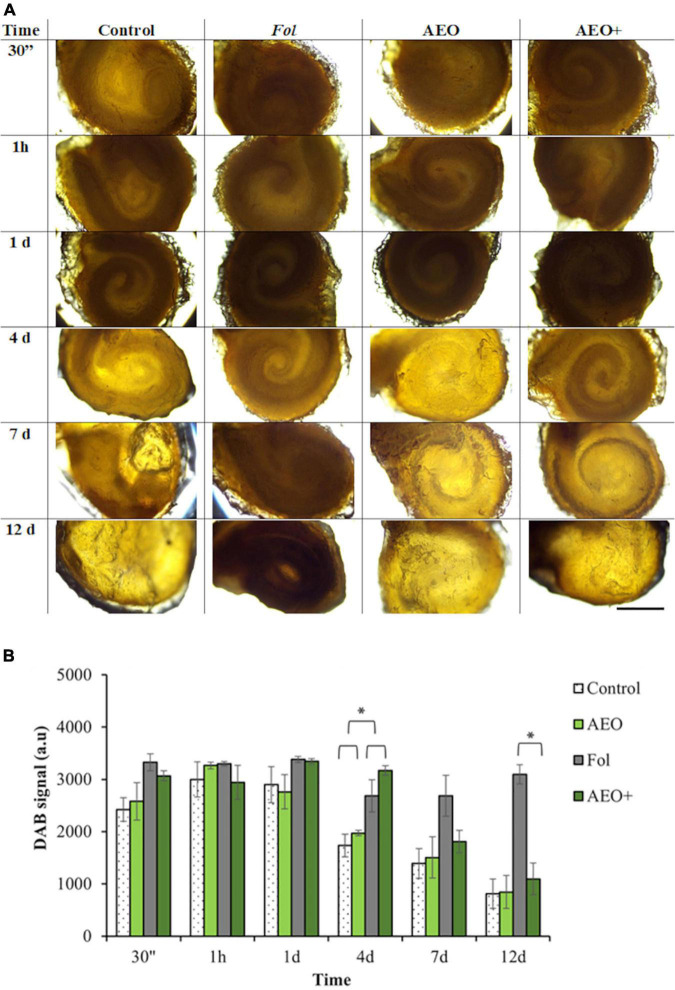
FIGURE 6.
Kinetic of Reactive Oxygen Species Production (ROS) on seeds. In day 4, the * denotes a statistically significant difference using variance check (P-value ≤ 0.05) and Duncan test. In day 12, the * denotes a statistically significant difference using variance check (P-value ≥ 0.05) and Kruskal–Wallis test. Tomato seeds were coated with 0.5 mg/ml of AEO. (A) Production of ROS on seed surfaces was followed by DAB staining of ROS production (see section “Materials and Methods”), after 30 min, 1 h, 24 h, 4, 7, and 12 days, on non-inoculated (–) inoculated (+) seeds with Fol (106 sp/ml), pretreated with AEO at concentrations of 0 (Controls) and 0.5 mg/ml. Bars (100 pixel). (B) Histogram showing quantification of DAB signal measured with Image J program (see section “Materials and Methods”). Bars (1 mm).

