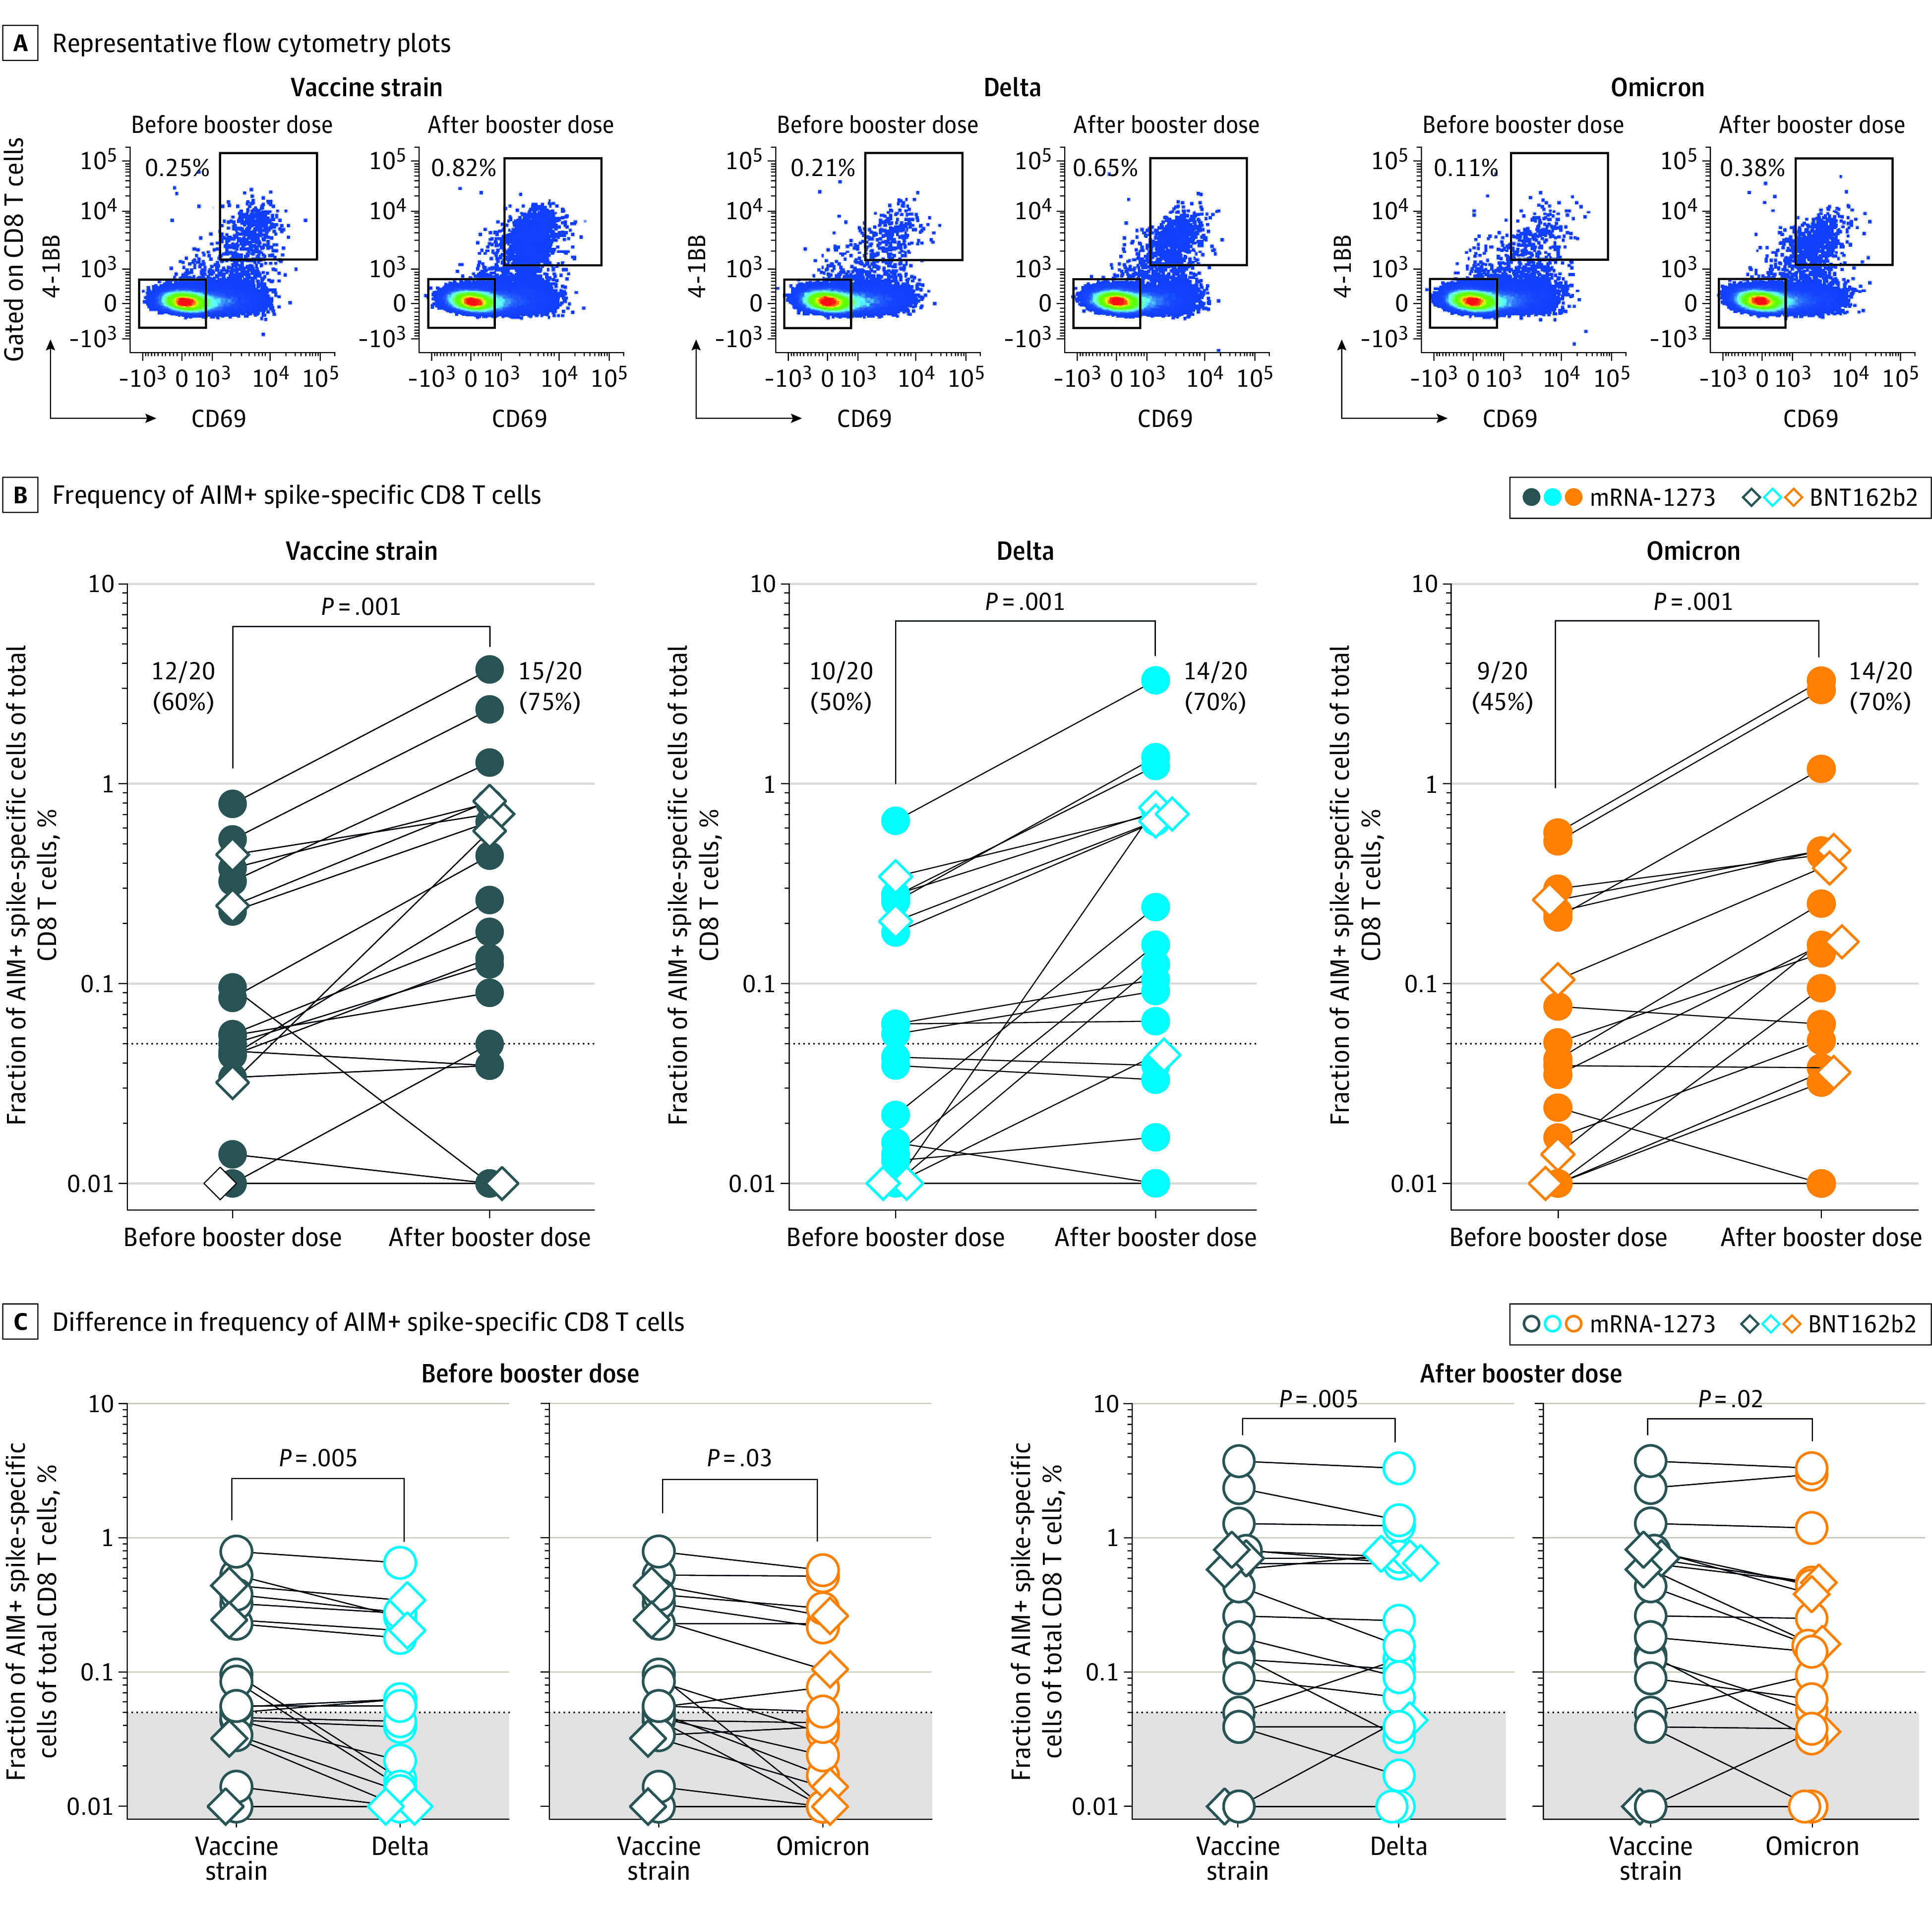
Figure 1. CD8 T-Cell Responses Specific for the Vaccine Strain and Variants Delta and Omicron After the Third Vaccine Dose.

A, Representative flow cytometry plots of CD8 T cells after peripheral blood mononuclear cell stimulation with spike-peptide pools from vaccine strain and the Delta and Omicron variants before and 30 days after the third vaccination. Spike-specific activation-induced marker assay (AIM)–positive CD8 T cells are gated as CD69- and 4-1BB–positive cells. B, Data from 20 ocrelizumab-treated individual patients. Each dot represents 1 patient, and lines connect prebooster and postbooster vaccination frequencies of AIM-positive CD8 T cells specific for SARS-CoV-2 vaccine strain and the Delta and Omicron variants and are background subtracted. The dotted line represents the cutoff limit. Percentages of responders (those with a level above the cutoff limit) are indicated. Patients vaccinated with mRNA-1273 are depicted as closed circles and those with BNT162b2 as open diamonds. The comparison between prebooster and postbooster vaccination was calculated using Wilcoxon signed rank test for all individuals. C, Differences in frequencies of CD8 T cells specific for the spike of vaccine strain vs Delta variant and for the vaccine strain vs Omicron variant in patients before and 30 days after the third vaccine dose. Wilcoxon signed rank test was used on responders to vaccine strain spike to assess differences between variants.
