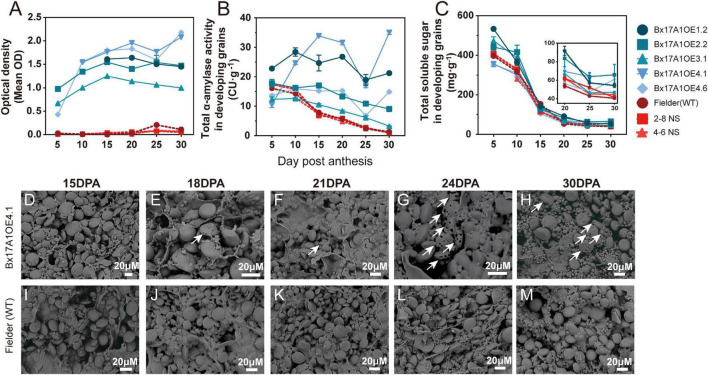
FIGURE 3.
Effect of TaAMY1 overexpression on grain composition and starch morphology during development. TaAMY1 protein content expressed by optical density (A) and total α-amylase activity expressed in Ceralpha Units (CU) of per gramme of tissue (B), and total soluble sugar expressed in mg.g tissue– 1 (C) during grain development. Scanning electron micrographs (SEM) of representative grain cross sections from Bx17A1OE4.1 (D–H) and Fielder (wild type, WT) (I–M) during key grain development stage. White arrows indicated starch degraded by TaAMY1.

