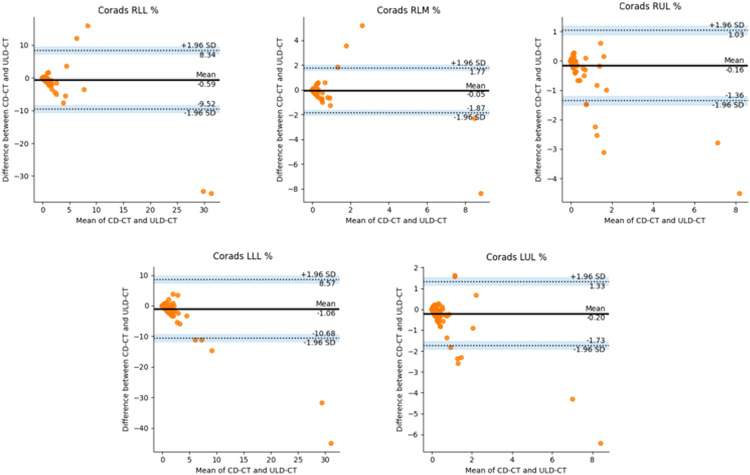
Figure 7.
BA plots generated using paired values, examined on LLL%, LUL%, RLL%, RLM%, and RUL% of CORADS tool. The black line is the mean of differences between two measurements; the dashed lines represent the test limits (mean −1.96 std/mean +1.96 std) and the dots are the paired differences of the two measurements (both dose protocols) for each patient.

