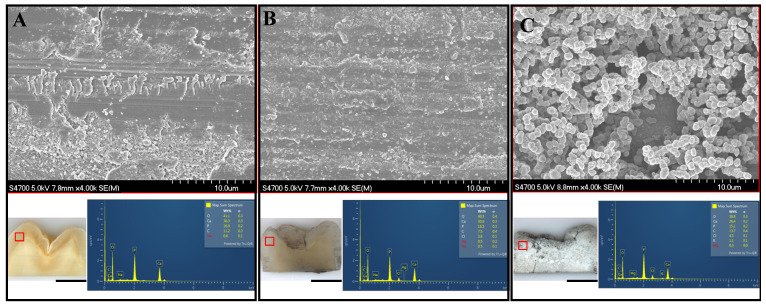
Figure 6.
SEM images and corresponding EDS spectra from the enamel tissue of the dental slabs shown in Figure 5. Representative images are shown for: untreated sample (A); SDF-treated slab (B); shADP-AgBP peptide applied to SDF-treated silver-stained dental tissue slab (C). Scale bar for 10× survey images (A−C) of dental tissue slabs is 1000 μm. Representative EDS spectra to determine Ca/P averages calculated across a minimum of three unique areas for each region studied.

