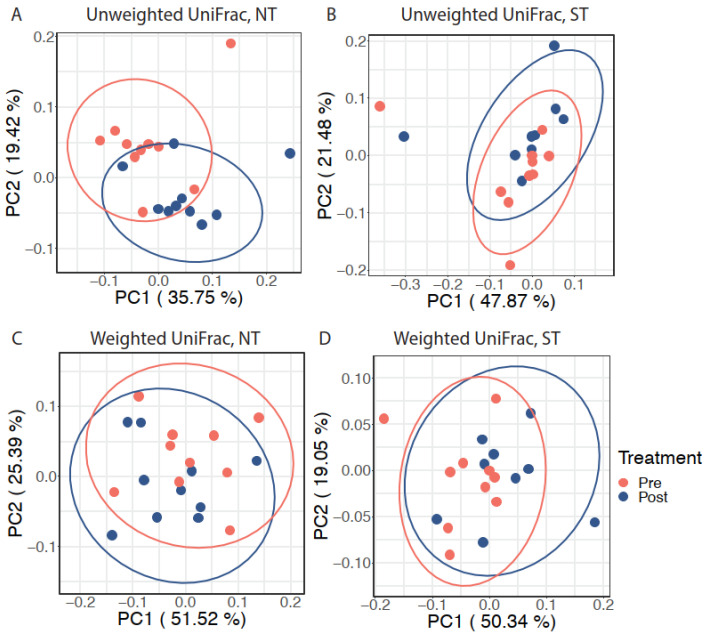
Figure 3.
The effect of CPE oral rinse on the oral microbiota with inter-individual variation adjustment. Adjusted principal coordinates analysis (aPCoA) plots on (A) unweighted UniFrac distance in NT subjects, (B) unweighted UniFrac distance in ST subjects, (C) weighted UniFrac distance in NT subjects, and (D) weighted UniFrac distance in ST subjects. Ellipses represent 95% confidence intervals.

